
Welcome to my Forex technical analysis trading blog. Today, I’m discussing a couple trades that I took in the currency pair GBP/USD. I liked the movement, so I took consecutive shots at the same pair. Read on to see how these trades ultimately played out.
First off, let’s start with my notes on this pair from the morning’s analysis:
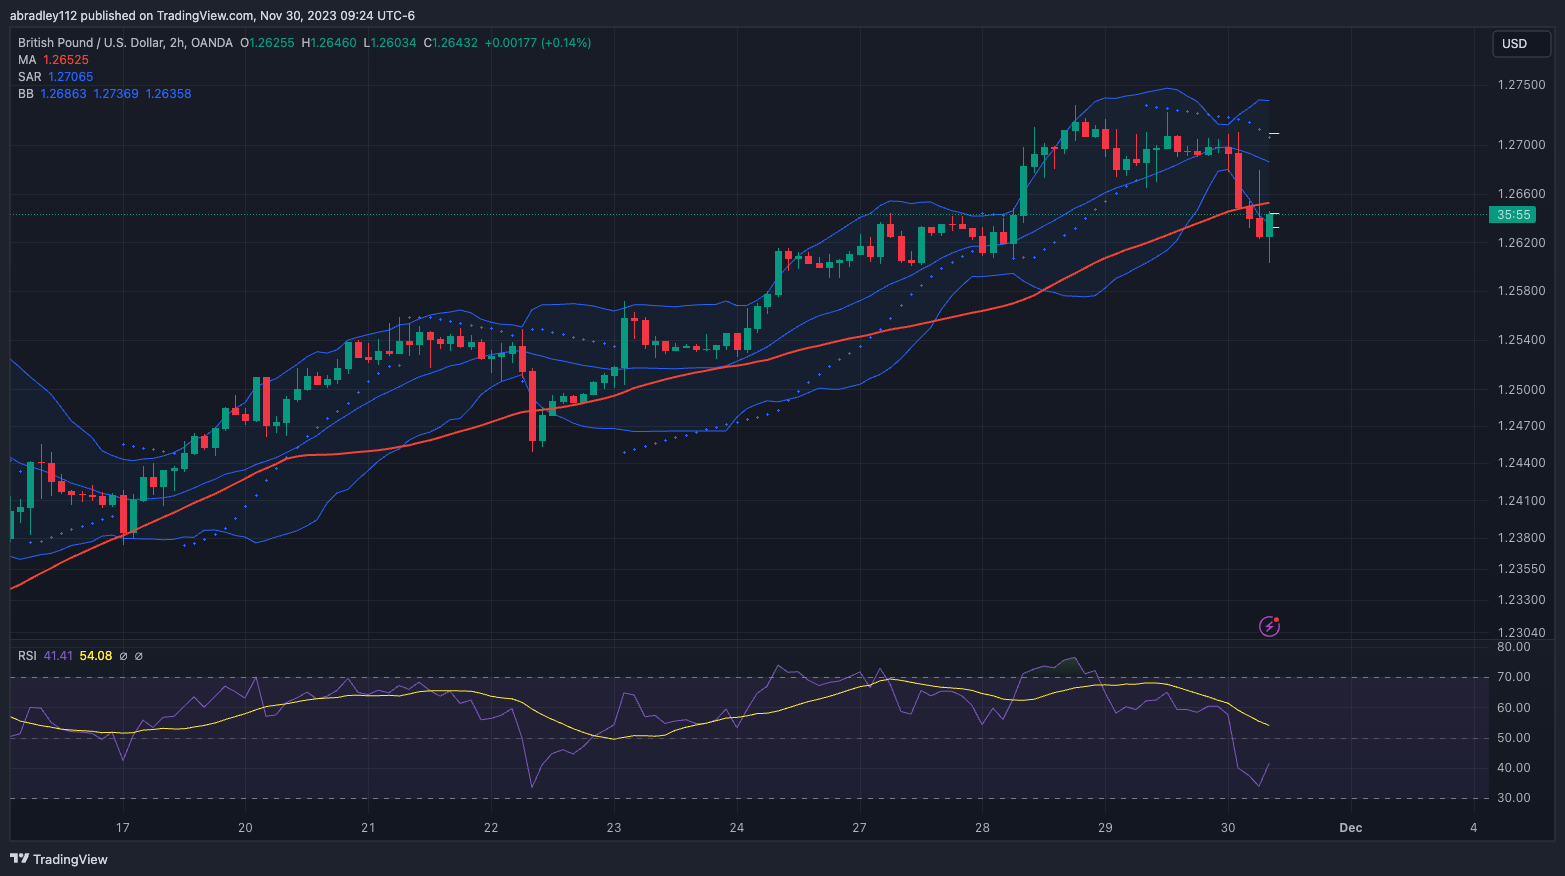
This looks really good right now. This has been on a strong push up since about the 13th of this month, but based/pulled back through yesterday. Price continued down overnight last night, and got close to the lower band/50 MA (they’re basically on top of each other here).
On the 2 hour chart, the current candle is up, and it looks like it could be making a move back to the up-trend. I think I’m definitely going to look for entries here.
There was a decent base forming (that could turn into a pullback) on the 5 minute chart. Maybe my target is a bit too high, but I’ve got a great 6 R:R, so I’m happy with this order.
This might have to break a couple key areas to reach my target, but I should be able to catch some pips even if it doesn’t get that far.
First Trade
Entry – 1.2644
Stop – 1.2633
Target – 1.271
R:R – 6
Second Trade
Entry – 1.2648
Stop – 1.2625
Target – 1.271
R:R – 2.7
Entry 1 – 1.2644 Exit 1 – 1.2633
Less than 5 minutes after entering my order, price made the push that triggered my entry into the trade. From there, price pretty immediately reversed and pushed down enough to hit my stop loss for a loss.


I still like the overall movement, though; and when I zoomed out to the 15 minute chart an even cleaner bull pullback had formed. I set a second set of orders to trigger if this bull-pullback completes and price does, in fact, head back to the upside.
Entry 2 – 1.26481
Price made a decent push up, and with my AUD/USD trade nearly reaching 1R, I felt good about this. Price pushed up to within 7 pips of 1R, but I wanted price to get a little closer before I moved my stop, so I left it alone.


Exit 2 – 1.2625
Price pulled back from there, and it was all over. Price never rose again and a little over an hour later had pushed down enough to stop me out for a full loss.
Once again, the overall trend was up and price was bouncing off of the lower band on the 2 hour chart, so I thought things were going to be great here. I still mostly chalk it up to another routine loss. That said, even on the 2 hour chart, price wasn’t coming out of oversold at all, and the RSI lines were actually sloping down at the time.

Conclusion
In hindsight, maybe I got a little overzealous here and I should have ensured ALL of the price action and indicators line up and not just one or two. I wanted to trade so badly (and am feeling so excited about/confident in my new strategy) that I ignored the conflicting evidence.
Oh well. Can’t go back. Today should’ve also been a break-even day, not a 2 loss day; but I missed a trade (didn’t hit the button) in EUR/AUD that would’ve hit my target if I just sent the order out. That can be a good or bad thing depending on perspective. I’ll try to look at it as a good thing as to not feel more discouraged.
I’ve mentioned it before, but I’m still learning/growing with this new strategy. So some growing pains are to be expected. I still got in to 3, nearly 4 trades today, and that’s good. Just keep swimming.
Thanks for reading! Today was a tough day, but ultimately I feel like it put me closer to my goals. Let me know in the comments how your performance is going and if there are any adjustments you need to make to your strategy. And as always, stay tuned for more financial market trades and analysis.