
Welcome to today’s entry into my trading journal. This blog is where I share my thoughts on various financial markets and instruments, and discuss the moves I make myself. Read on to see how this long EUR/AUD Forex trade played out.
Price had been pushing up quite strong for close to a day, and appeared to be returning to the uptrend it had been in since the beginning of October. Here are my notes from that morning’s analysis:
Euro-Aussie has been kind of wild. Starting late September, I’d say this is definitely trending upward. I’m on a daily chart now, which admittedly is a little zoomed out if I want to trade the 5/15 minute charts, but that’s where I’m starting. Price reached a high back on the 24th, pulled back from there, made a higher low, kind of trended down a little bit from there then bottomed out.
Once it bottomed out, price made more higher lows and today is pushing up again. Price has pushed up against the resistance area that’s in the middle of this uptrend that it’s been in, but RSI is just above 50. It’s also in the middle of the Bollinger Bands and the bands are expanding.
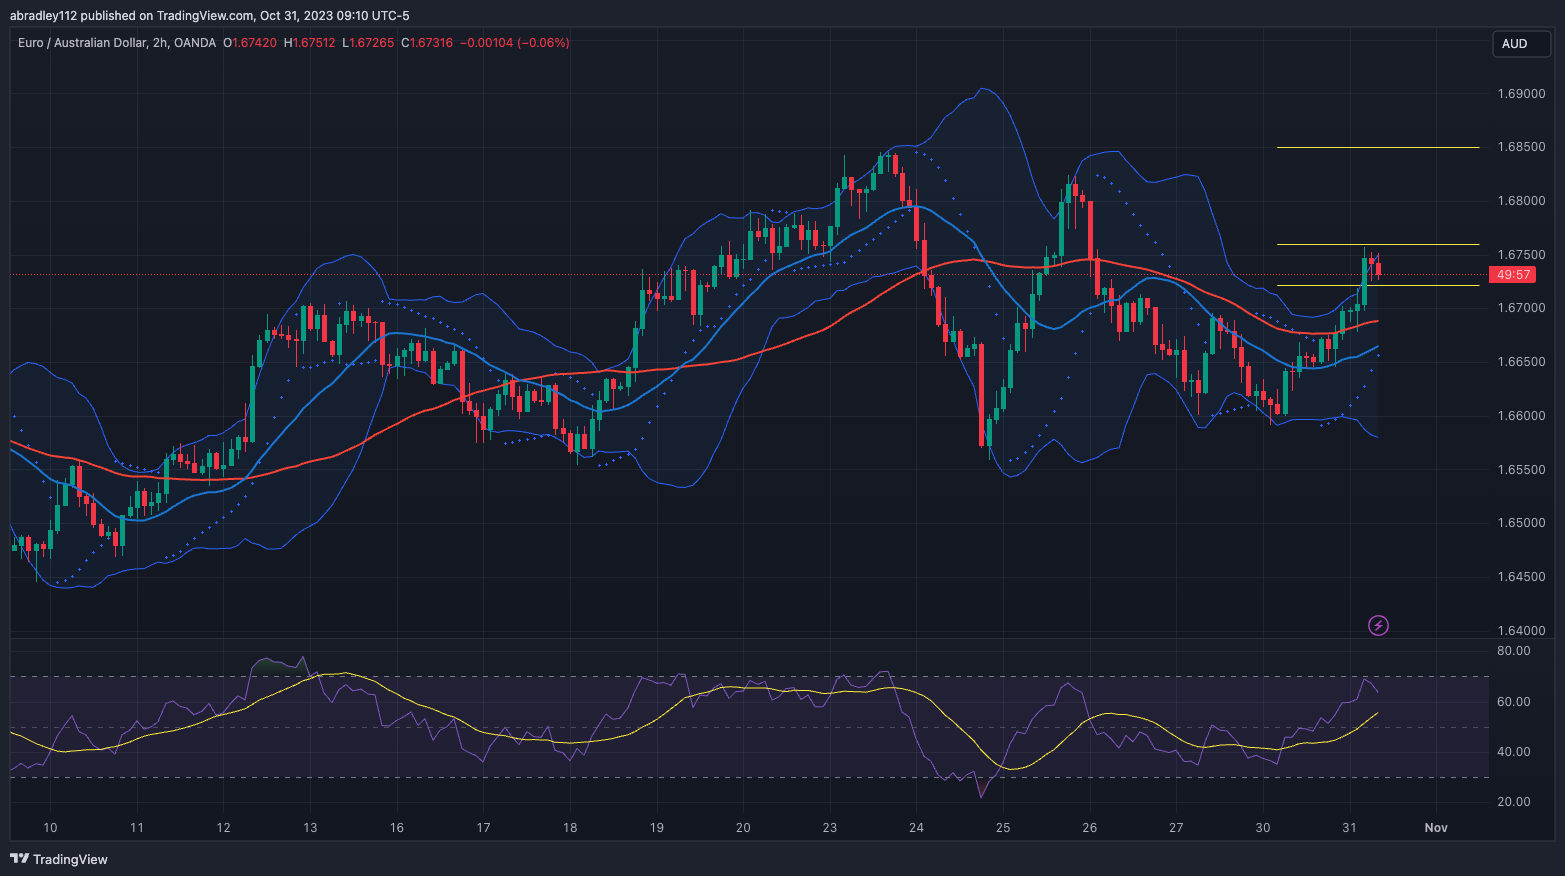
On the two hour chart, it looks like price is riding the upper band and RSI is closer to overbought but not quite in overbought levels. I’m also seeing a bit of a base on the two hour chart. Dropping down to the 5 minute chart I’m just seeing range-bound trading, which strengthens the base pattern on the 2 hour chart. So I think I’m going to trade this base on the two hour chart and just understand that it’s a longer term play.
Entry – 1.676
Stop – 1.6722
Target – 1.685
R:R – 2.37
Entry – 1.67601
It took a little over an hour (which was fine, given the fact that I was trading a 2 hour chart) but price eventually made a push up enough to trigger my entry into the trade. By the time it had triggered, price action looked more like a bull-pullback than a base; but it never dropped below my stop level, so I left it alone.


Exit – 1.6722
The push up that triggered my entry was all the upward momentum this had as it dropped immediately from there. In less than an hour, price had pushed down enough to trigger my exit and then some. I must have missed a news event or something because this was a sizable drop.

The upward momentum looked good, the base/pullback was relatively clean, and RSI was pushing up and not yet in overbought territory, so I can’t see any glaring mistakes here. Maybe I could/should check the news events for the day each morning and not trade any currencies that has an announcement soon (as I was essentially taught to do).
There area couple of issues with that, though. For one, news events can be catalysts for large movements. So if I’m on the right side of them, they could be very profitable; and if I’m on the wrong side of them, my stop loss will be hit and I’ll take a normal loss. The other issue is that when I was at my most successful, I wasn’t paying attention to news events at all.
For now, I’ll continue my typical workflow, and I’ll start to pay attention to news events when I feel like they’re really affecting my trading in a negative way.
Conclusion
Maybe this was a poor trade, let me know in the comments what you think. I don’t actually think it was, though — it was simply another routine loss. I’m not in the predictions business, I’m in the probabilities business. I’m going to do my best to take this one in stride and continue to look for great opportunities to make money!
As always, come back soon to see more Forex market analysis and trades.