
When I began analyzing the charts that morning, the market was in recovery mode, prompting me to look for long opportunities. However, as the market reversed, I had to quickly shift gears and start looking for short positions. But, as the S&P broke through the day’s highs, I re-evaluated my strategy and decided to enter a long position on MSFT (Microsoft), which I had previously identified as a potentially profitable trade. Here are my notes from that morning:
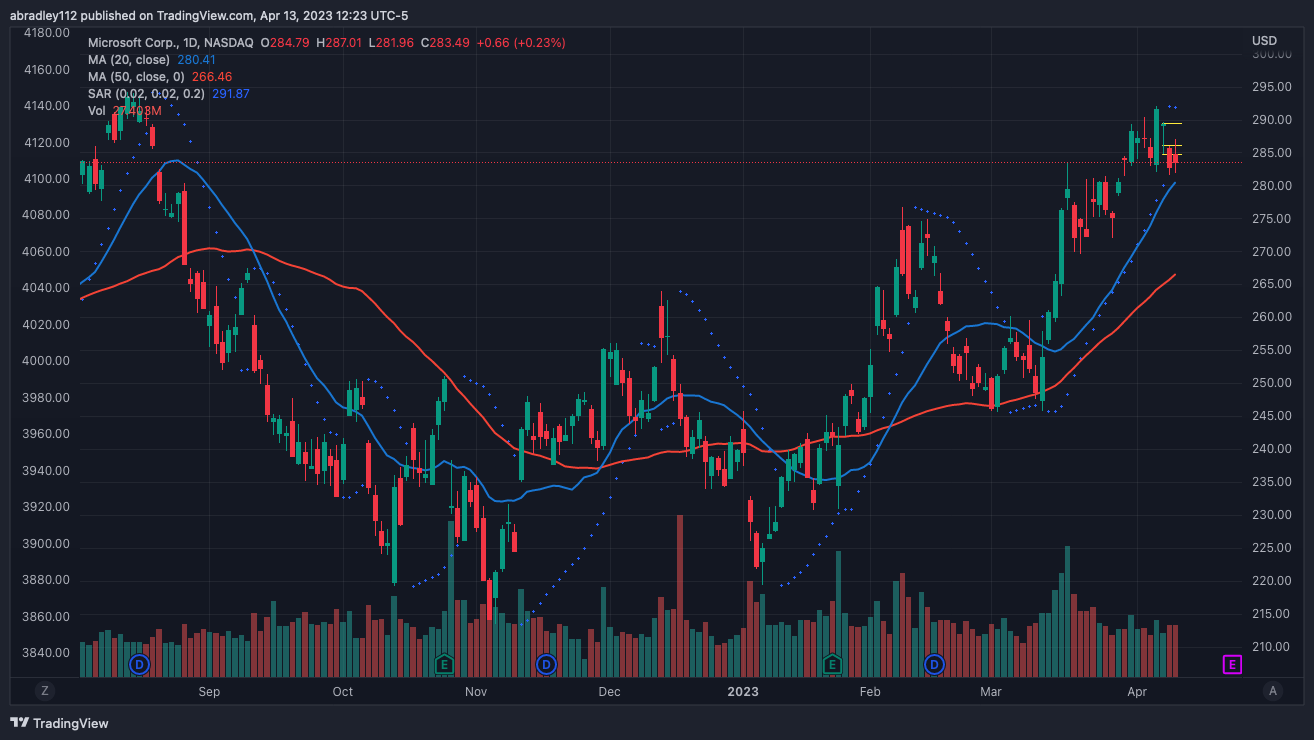
This is the first interesting thing I’m seeing today. Looking at the daily chart, price has been pushing up since the beginning of March, reached a peak about 4 trading days ago, and has pulled back from there. It reached some support (that was prior resistance) and today, has pushed up from that level. Right now, the candle that’s showing has a long lower shadow and almost no body.
On the 1h chart, price gapped up a bit and had a strong push, then pulled back during the next candle. The pullback is to a strong support level (again, on the 1h chart) and if it can break the day’s highs, there’s some gap to fill. Since I’m bullish overall right now, this pullback looks like the perfect opportunity to get in to. I’m going to set an entry on the break of the day’s highs if the R:R is there.
The market failed to hold on to any of the early gains, and failed to make another push up to/through the day’s highs. It actually, has started to drop and is down ~1/4% now (at 10:00am). So, I’m shifting my outlook because I didn’t really see any longs I liked anyway (shortly after setting my entry order in MSFT price continued to drop, taking out my would-be stop by a lot, so I cancelled the order).
Update: 11:13 — Equities began to rally, and pushed up to +.24% on the day — it appeared the strength came back. I had cancelled my MSFT order because it pushed down through my stop level, but coming back now, it only wicked below that — that candle closed above. With the market rallying, I decided to put the order back out there.
Entry – $285.17
Unfortunately, I accidentally left my entry order at the default “limit” type, so my order was filled right away. I double-checked, and I do have my default set to “stop” order rather than “limit”, but apparently when I do an “order with stop” or an “OCO“, it goes back to “limit” as a default. Just need to pay attention.
Entry – $286.20
Target – $289.50
Stop – $284.75
R:R – 3.3


Exit – $285.16
On the bright side, price was strong, so it made it to (the new, based on my actual entry) 1R, within the next few minutes, but that’s roughly as far as it made it; it pulled back from there and stopped me out at, basically, break even (a 1¢/share loss, again).

Ultimately, had it triggered correctly, it would’ve been a full loss, so I guess that’s something. But still, I can’t call this a good trade. I made a mistake with my entry, and happened to get lucky. That said, with a smaller risk size, the path to 1R was smaller, which is something I try to keep in mind, but it has to all be within the framework of my plan and the patterns I see.
Price did, as of this morning (4/13) push up through my initial entry and to my original 1R — and look like it might hit my target — but based on how I trade, and traded it yesterday, I’m not sure I would’ve caught it. I think I’m just going to completely put this one out of my mind, act as if it was a practice trade on a strategy that I “just want to see how it would work” and move on.
Just keep swimming.