
I came across this stock and it’s chart pattern last week, so I’m updating this a few days late. Here are my notes from the morning of the trade:
I set an alert here last week to let me know when it reached a recent support level — it reached a strong resistance area, and I thought price would drop from there, and wanted to know when/if it got to ranges I wanted to trade. I got the alert yesterday, but it was right before the market closed, and I wasn’t at the computer. Looking today, and this morning, it’s already made another strong push down, and has stopped at a support area that was fairly strong resistance a few times in the past. On the daily chart, I see a small rally from that point, so I’m going to look for entries on the 2h chart.
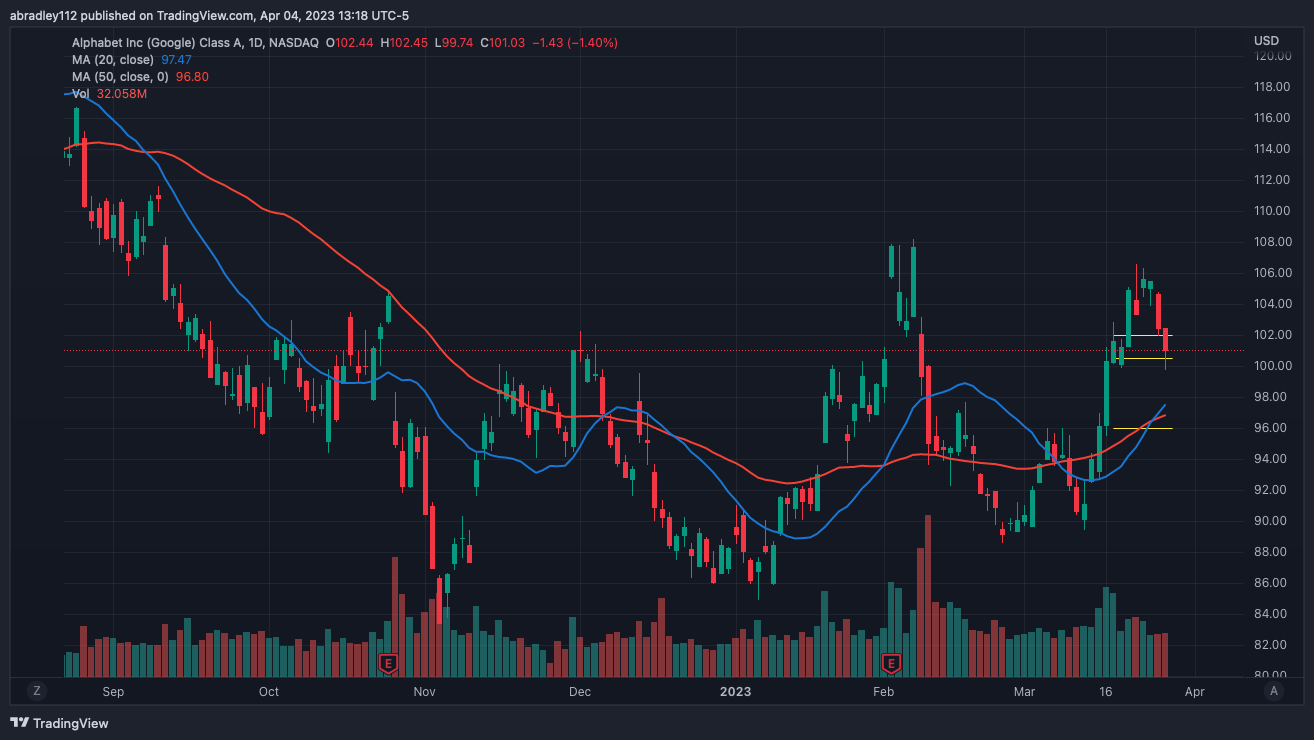
Immediate update: I looked at the 2h chart, and even dropped down to the 15 min. chart, and this dropped too sharply, it looks extended to me. If price rebounds to around $101 – $102, I’ll look to short from there, but I don’t see a pattern here — at least not on the 2h chart. I’ll set another alert here and maybe revisit later
Update 9:16: I got the alert that price rallied, looking to enter a small short position here.
Entry – $100.49


Exit – $102.45
Price largely pushed up after triggering me in to the trade, but didn’t do so quite enough to stop me out of the trade the day of. I had faith in my analysis, so I left my order along, but the next morning, price gapped-up and stopped me out almost immediately at the open.

There was a strong support level that price had stalled at, and a good amount of room below that level, so from that perspective, this wasn’t a bad trade. Looking today, though, I’ve got a slightly different perspective. Really, only one, and it’s something I’ve called out in the past: I need to make sure that the security has shown trending signs in the direction I plan on trading. This was actually, based on my definitions, trending up when I took this trade, and while the most recent move was down, it hadn’t established a down trend.
I played this off of a long-range double-top, and really, the double-top bearish move had already happened — if it even was a double-top. The other “top” was from early February, which was a while ago — probably disqualified this. Also, looking at my analysis again, I thought this was extended initially, but within the hour price had rallied, I changed my mind, and started looking for entries. If I’m trying to trade longer-term, and hold overnight, I probably shouldn’t take trades in stocks making that wild of swings. At the very least, I should take a wider stop/target level, but, really, I should probably avoid it.
Hindsight being 20/20, I made a couple mistakes in this trade, and I need to clean them up. Losses happen, I’m going to learn and grow from this one and just keep swimming!