
I came across this chart pattern to trade yesterday morning, and held the trade overnight. Here are my notes from then, prior to taking the trade:
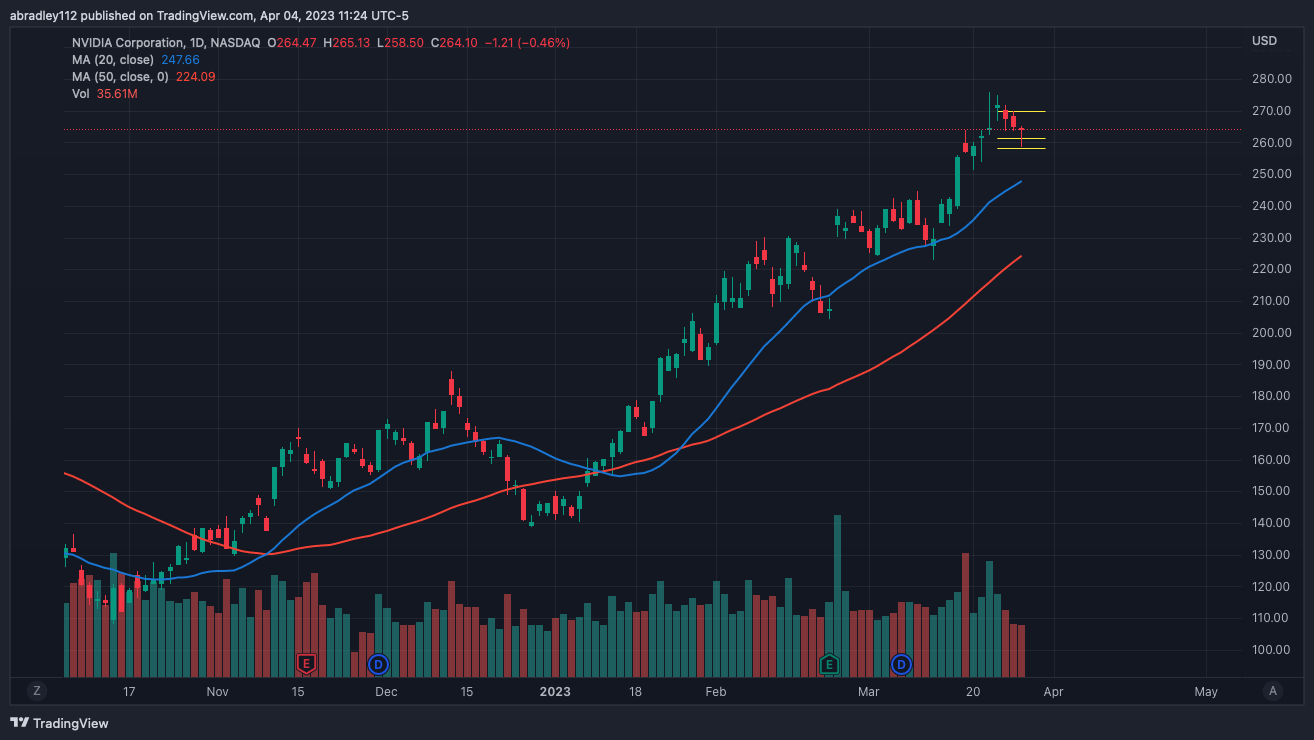
I made a good trade on this last week, but it was in my practice trade accidentally. Looking at this today, price has been pulling back from a spike about 4 trading days ago, and today, is sitting on a support level that was resistance last week. When I “missed” this last week, it pushed too much for me to consider getting in, in my main account, but this pullback might offer a perfect retest to take another shot at. I’m going to look for entries here
Entry – $261.25


Exit – $268.00 & $270.00
Price moved in my favor almost immediately after triggering in to the trade. It hovered around my entry for most of the day, but never really showed signs of pushing back down. Then, right before the close, made another large push up and hit 1R as the bell sounded. I moved my stop to break even at that point, though it didn’t really matter because the market was closed — it wouldn’t take effect until the next morning.
Entry – $261.25
Target – $270.00
Stop – $258.20
R:R – 2.87
The next morning, price gapped up strong, and pushed up enough to hit the take-profit that I had set for half of my shares. I had locked in profit, and still held some shares in case there was another push up. Since price had hit my target, it was being aggressive with my stop, so once a base formed on the hourly chart, I moved my stop to just below that. It didn’t take long, though, for price to drop enough to trigger my exit, but also in profit.

I wanted to practice using a take profit in a live account — which I did, and it worked beautifully, so that’s one positive with this trade. I guess, in hindsight, if the retest candle had pushed up enough to be the one to trigger me in to the trade, I might not be as happy with that move/it might not have worked out. But at the same time, if I had waited for confirmation and then either missed the trade because the subsequent candle moved too quickly, or it did trigger on that candle and still pushed higher, I’d be kicking myself, I think.
Going forward, I’m going to be mindful of what the most recent candle is doing when I’m putting in orders, but I’m not going to alter my trading too much because of it. Really, I do keep an eye on the bar’s countdown so I have an idea of how close lower-time-frame candles are their closing; so I’m satisfied. Overall, this was a solid trade and a good win.