
Practice Trade
This was another stock trade I took in my practice account because 1) I wanted to practice using a limit order, and 2) I wanted to practice my new trading strategy where, based on the candlestick patterns, I’m getting in at levels I’d, in the past, place stops — to make larger profits and get faked out less. Here are my notes from that morning:
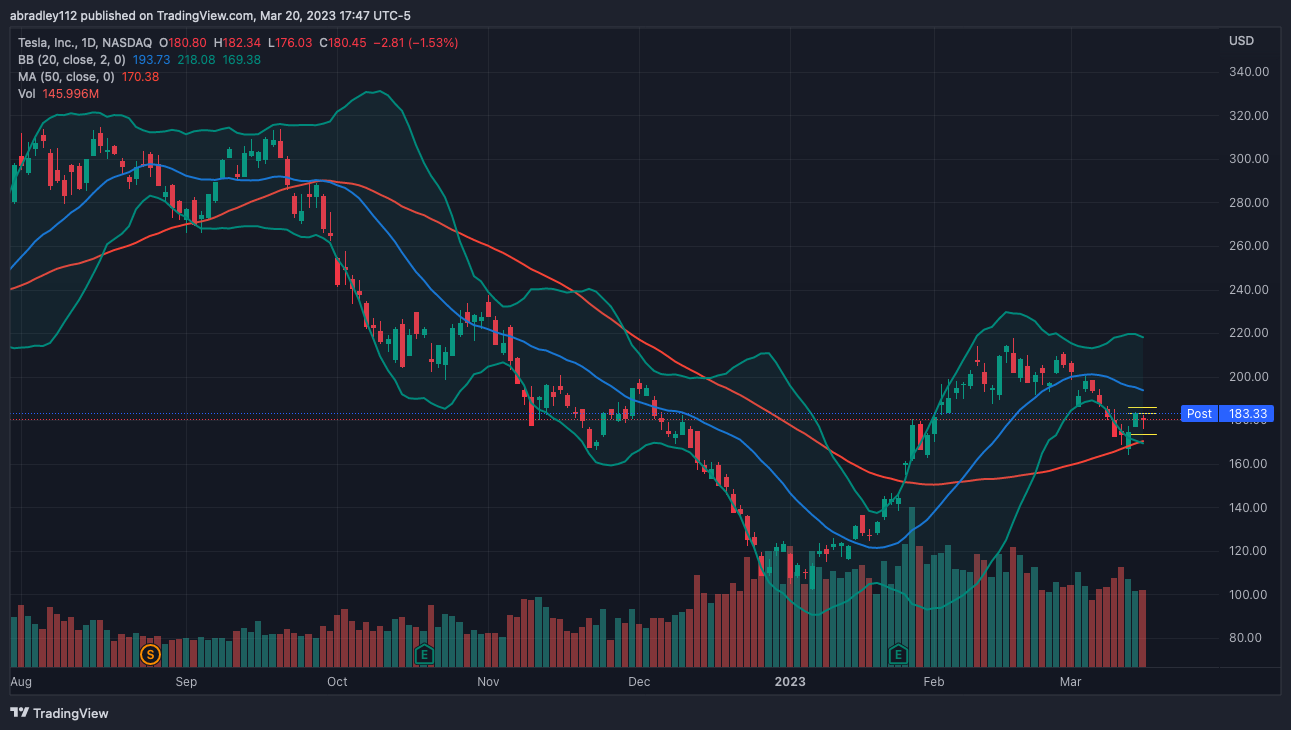
I lost a trade here earlier this week, but I’m still bearish. So, I’m going to take another limit order practice trade in this. It’s been pushing up over the last day, and has hit some resistance. If it reached the top of that resistance area, I’m going to try to short in to that with my stop being the next level above. I’m less interested in R:R for this, since I’m practicing the strategy and entry order more than anything, but I’ll still run the numbers.
Entry – $183.5
Target – $173.50
Stop – $186.00
R:R – 4
Entry – $183.50


Exit – $181.25
This looked like a mistake initially, as price pushed through my entry, nearly hitting my target, and hovering around that area for the rest of the day. Hard to imagine I wouldn’t have been one of the orders that got triggered during that sideways movement.

I wasn’t in this trade, though, and the next morning, price dropped strong, quickly reaching 1R. I moved my stop at that point, and then moved it to a resistance area in profit. I had that stop, as well as a stop at the target level, so I just left the trade as is. I’m sure I would have gotten stopped out if it was a live trade, so I don’t want to inflate this win too much.
Price slowly pushed up for the rest of the day, but not enough to trigger my stop. By Monday morning, though, it spiked and did trigger the exit. It was a win in the practice trade, but like I said, I don’t see how I wouldn’t have gotten stopped out at the level I set my stop-loss initially. Price wicked above it a couple of times, so I’m not sure why it didn’t close my practice trade. I still like my strategy of getting into retests sooner than later, but I’m not ready to use limit orders in a live account yet.