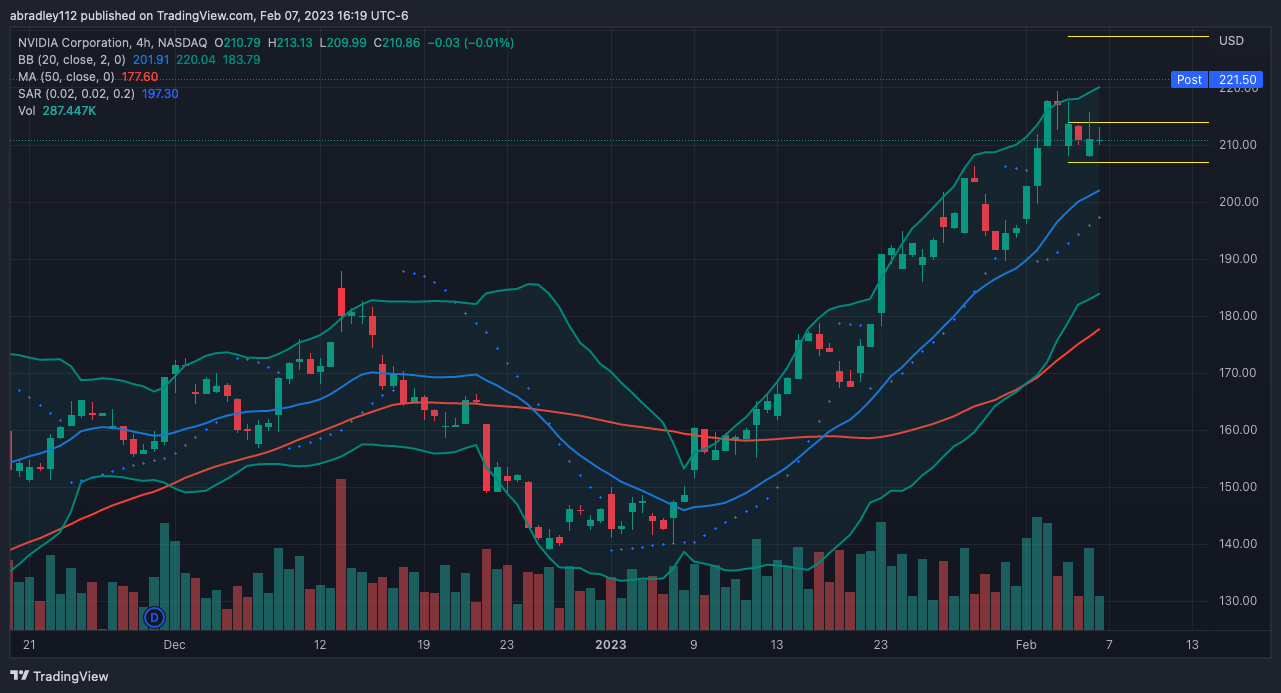
I saw this after hours yesterday when doing a weekly analysis. It had a nice bullish flag forming on the 4 hour chart, and I didn’t want to miss it. I ran the numbers last night, but didn’t pull the trigger. I wanted to make sure I was as clear-minded as I could be. Here are my notes from then:
Over the past 2 weeks, price has taken out a couple of key levels, and, like a couple others here, peaked last Thursday, reaching a key level from last year. Unlike the others, though, this one has held on to it’s strength for the most part, with both Friday and today closing higher than it’s open. The 4h chart looks like a pretty decent flag, so I might consider a longer-term play here, too. Another pro for taking longer term (4hour+ charts) trades is I can put multiple trades out in one day because the chances of them triggering an exit in the same day is less. I thought that’d be the case with hourly charts, but so far hasn’t been. I need to go out one level, and this looks like a good candidate for that.
Entry – $214.10
This morning, I still liked what I saw, and price was up pre-market. Price pushed up at the open, and I thought that I’d miss my entry, but I didn’t. I was able to get my order in and it triggered fairly quickly. Over the next hour or so, price stayed strong, eventually reaching 1R (which was $221). Price started to drop once it reached that high, but I moved my stop to break even, following my rules, and was very optimistic.
Entry – $214.00
Target – $229.00
Stop – $207.00
R:R – 2.14
Exit – $214.11
That drop proved to be stronger than I hoped because while I was taking care of some laundry, I got a notification that my order was filled. I came back to the chart to see that price had pulled back on that candle, enough to stop me out and then some a little bit. On the bright side, I closed out a penny above my entry so it’s technically a win.
The market is closed now, and price closed at $221.73. It pulled back in the afternoon just enough to stop me, and I presume others, out and pushed back up to the day’s highs. I took this trade on a 4h chart fully anticipating not getting out of it for at least a day, but I still managed to get in and out today. It really feels like brokers, or the platform itself, hunts stop losses, though truth is, it’s probably just chance. I just need to keep honing my edge and following my rules.

The funny thing is, it looks like both my AMZN and SHOP practice trades, with my new strategy I talked about yesterday, closed well in the money. I know it’s a relatively small sample size — as far as actual trades — but I wanted to implement this strategy because I see something, and I think it might be enough to start looking at using this on in my live account.
I suppose there’s a chance, since I didn’t look at those two trades all day, that price could have moved in a way that would have stopped me out at my current rules, as did this trade, but I guess that’s something I’ll have to confirm before I really start using this strategy. Also, does this mean I should start thinking about not moving my stop loss for the remainder of the day, no matter how price moves? I don’t think that’s a good idea…
I’ll post my journal for the two practice trades, too, since they involve a new strategy
Also, Here’s a screenshot of the 15 min. chart to show the drastic drop then subsequent rise back to the day’s highs.


