
Updating on 1/18
Here is my write-up from when I analyzed this stock and decided to take the trade:
For the last 3 days, price has reached the support level it reached today, left a wick down there and traded above that price (while still remaining down on those days). Today looks similar — it’s down, it wicked through that support area, but is trading above it right now. With all of this downward pressure, it would make sense that it would break at some point, and while I don’t exactly see a pattern on the 5 min. chart, it’s double-topping right now, and could offer something in the near future. It’s not amazing, but it’s my favorite chart right now, I think I might keep my eye here, looking for an entry signal
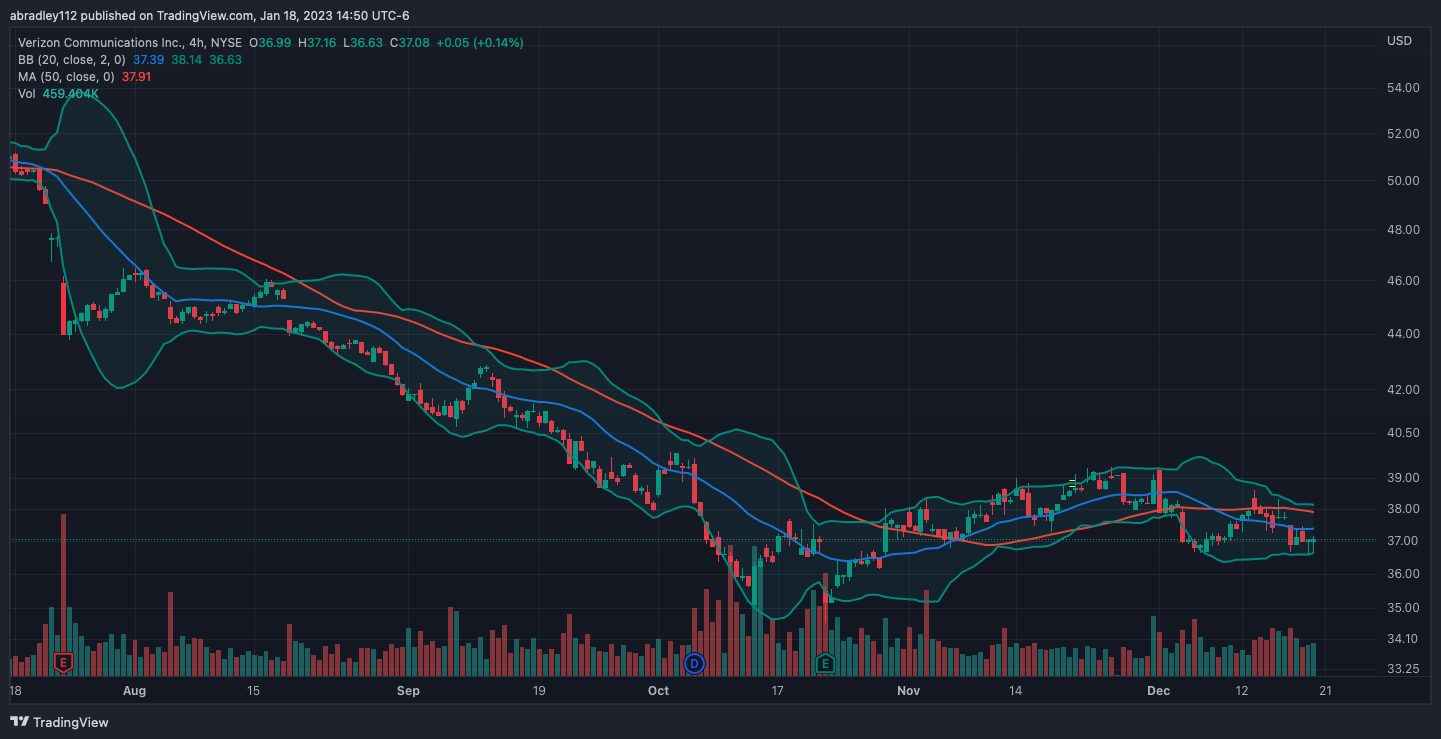
Looking at the 4h chart today, price had been pushing down for over a year, with a sharper decline over the past 4 months. The immediate few weeks prior to this trade price had a bit of a rally, which almost looked like a reversal, but then made moves that suggested it was heading back to the downside.
Entry – $36.89
On the day that I took this trade, price reached the support area that it created before the most recent rally, broke it slightly, then rallied again, which is where I looked to find an entry point.
Looking at the 1m chart right now, I’m not 100% sure where my thought process was. There was a pretty fast rally at the open, then price moved sideways for a bit, made another move up, moved sideways again then started to push back down. Based on my prior write-up and my entry/stop points, I think I liked this enough that I was less adamant about the clearness of the pattern, and simply wanted to get in at the break of support. Despite it not being an actual pattern that I can meaningfully call out, it looks like I just put a stop at the next resistance area above that support area — also, with only a 10¢ target, I needed a risk level that offered a 2:1 R:R
Entry – $36.90
Target – $36.80
Stop – $36.94
R:R – 2.5


Exit – $36.84
After the second “base” price did start to push down, eventually hitting my entry point triggering me into the trade. Price continued to push down from there for the next few minutes before it based again then made another push down. I mention that next base because right above it is where I ended up getting stopped out. I’m fairly sure I followed the SAR on this chart, as I don’t go shorter than 1 min., then when a firm resistance area formed, I left my stop there while the SAR moved sideways. I wasn’t able to move it again, though before price pushed back up enough to trigger my exit for a decent little profit.

Looking today, I don’t love the entry signals that I gave myself. A) Price was on a strong rally, which doesn’t bode that well for shorts (though it was a 1 minute chart, so that’s not that big of a deal) and B) This was the classic case where I wanted to trade a base in the opposite direction of the preceding move, which, from everything I’ve learned, does not constitute a base. I happened to win this trade — I picked the right direction and I was able to get in and out quickly enough that I made money, but going forward, I want to make sure that the chart patterns make more sense.