
Updating on 1/18
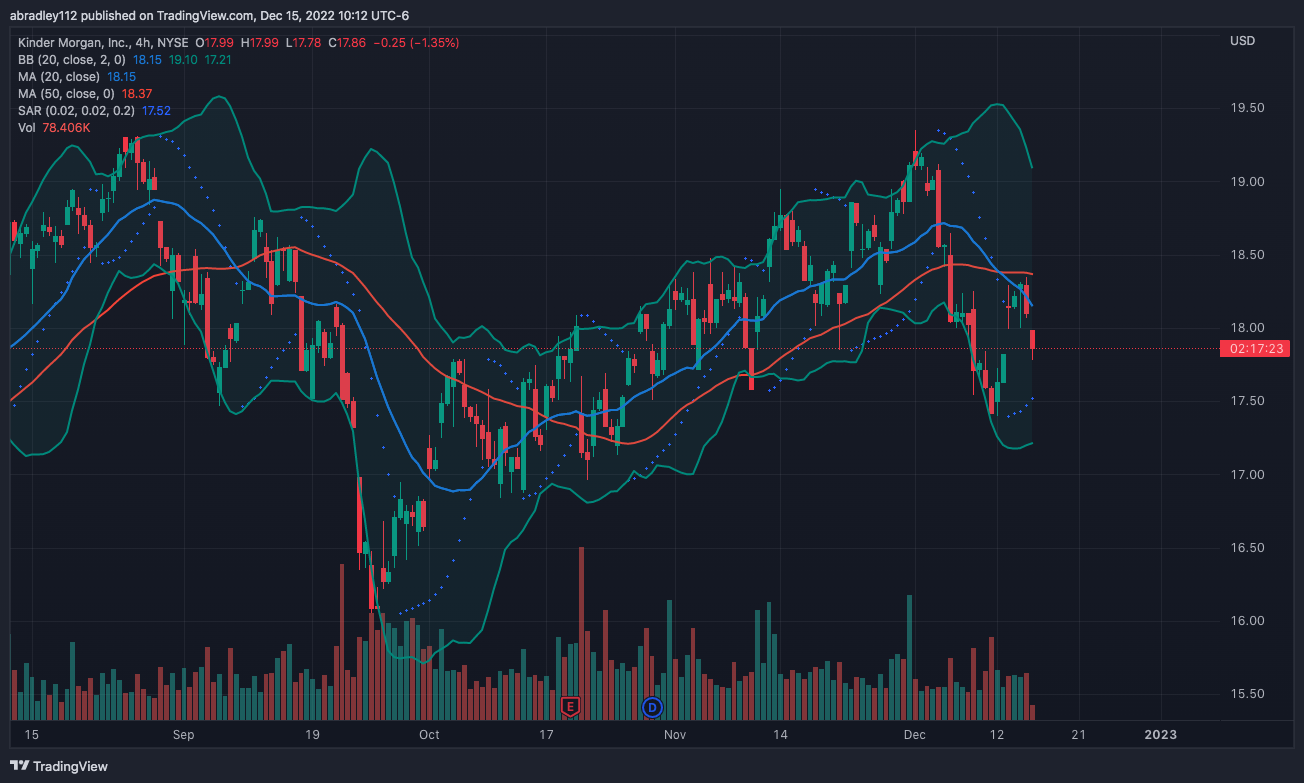
Looking at the weekly chart, this had been in a wide range for the last several months. Over couple of months preceding this trade, it was mostly pushing up, but at the beginning of the month I took the trade (December) it had pushed down quite strongly from the range high over the next several days.
When I got to this chart on the day I traded it, it had gapped down, and continued to show me weakness. I dropped down to the 5 min. chart to find an entry pattern. Price reached a recent low and rallied, breaking a minor resistance area, then started to push back down — I entered my orders to trigger on the break of that resistance area that became support, with a target just outside of the lows of the day.
Entry – $17.85
Target – $17.75
Stop – $17.90
R:R – 2
Entry – $17.85


Exit – $17.74
It being over a month later, I can’t remember exactly how I managed this trade. Price quickly pushed down after triggering me into the trade, and I was able to move my stop to break even, then into profit pretty quickly. I have to imagine I started following my stop-loss along the SAR on the 1min. Chart because price pushed to and through my target. I was eventually stopped out, but for a nice profit technically a bit beyond my initial target level.

Again, it’s been a while since this trade happened, so I can’t speak to the specifics of it. Looking at the chart today, it looks like a solid trade with no glaring mistakes. The rally and subsequent push back to the downside wasn’t the prettiest I’ve ever seen, but it was a bear rally. And I didn’t sit on it for a long time hoping it triggered me in (and thus, not having the momentum to give me much profit). I wouldn’t say that I’d look for this exact pattern again for a winning trade — at least this exact formulation of it — but overall I’m happy with how I handled this, if I’m remembering things correctly.