
I looked largely through the sizzle index this morning, and I came across NCLH. I saw a couple of other things, but they were extended, and while I did put in some entry orders, price pushed in the other direction and I cancelled them.
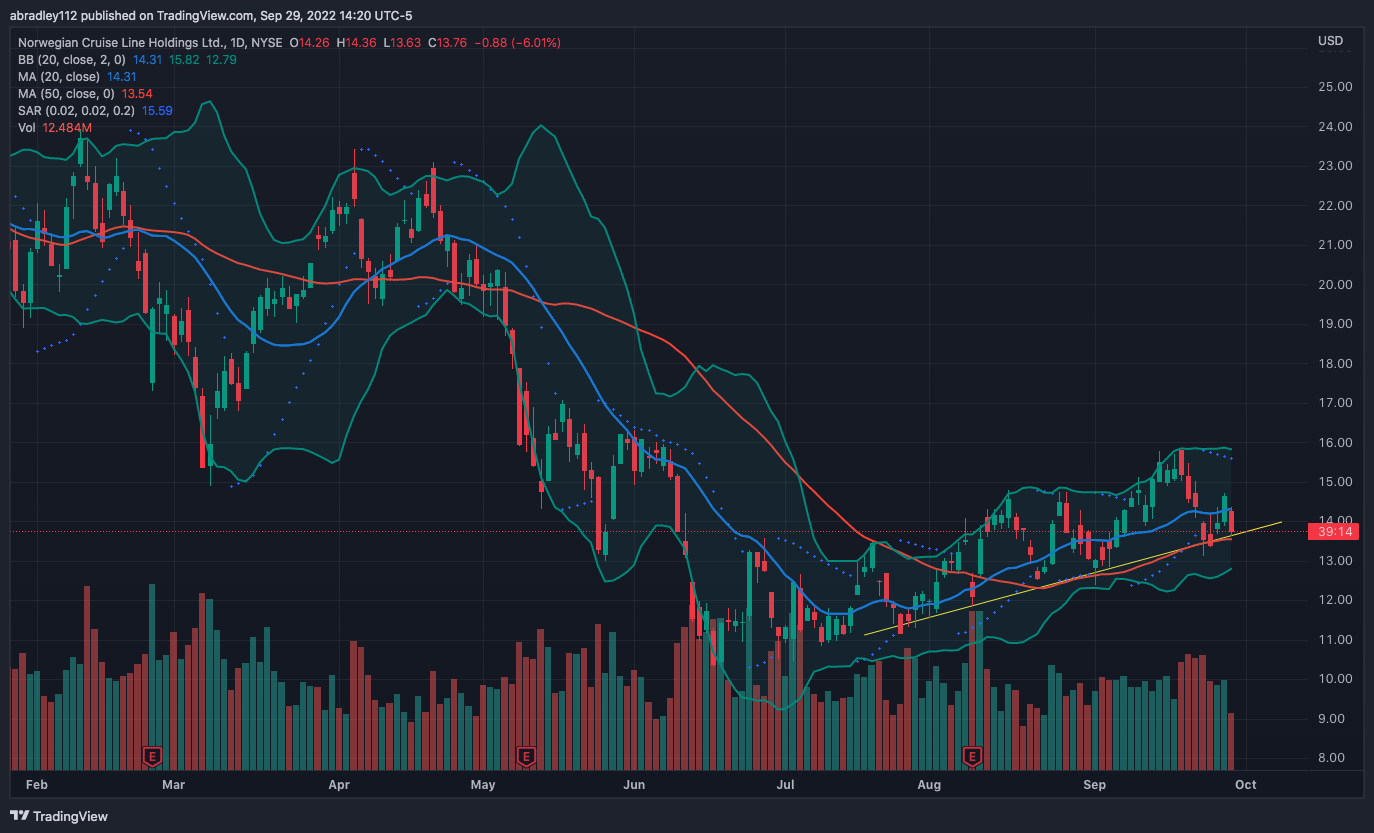
This, though, was trending upward on the daily chart, but, drawing a trend-line, price had touched it and if it were to follow the trend, looked to me like it should push up from this area. I looked at lower time-frames and saw a decent double-bottom/bull pullback had formed, with a 10¢ stop and, I mean, incredible upside if it were to, in fact, continue the trend from that line. Still a solid 2R:R just to the next resistance are, too.
Entry – $14.10
I put an entry order here, with an alert to let me know when it triggered, but like the other things I had looked at, price pushed down below my stop and I cancelled my order. Later, though, the alert that I set had hit, so I looked back at this chart, and it just touched that area, and was forming, maybe, another bull pullback, so I set entry orders again.
Entry – $14.10
Target – $14.30
Stop – $14.00
R:R – 2


Exit – $14.09/$13.66
Price did push up in my favor. Danced around a bit, and got up to within 2¢ of 1R, which is when I moved my stop to break even — price was moving slow, so I wanted to lock it in. Shortly after that, price did pull back enough to stop me out of the trade for what should have been a straight up break-even trade (technically a 1¢/share loss because my stop was at $14.09, not $14.10), but I looked at the end of the day and for some reason, only 100 of my 150 shares sold.
So as price had been pushing down, I was still holding on to 50 shares…. I sold those as well, for a loss of an extra $0.44/share because… idk why. I might’ve been at fault. I have to do more digging. Maybe tomorrow or something, I don’t want to right now. Not happy about it and don’t have the emotional energy for it.
