
Trying different strategies over the last couple of months (sometimes out of a desire to get better, sometimes out of necessity based on what I did the night/weekend prior — lately, it’s been the latter), lately I’ve been day-trading, doing my RSW the morning that I trade (rather than doing it on Monday for the entire week). Today was no different, and I ended up taking a couple of trades.
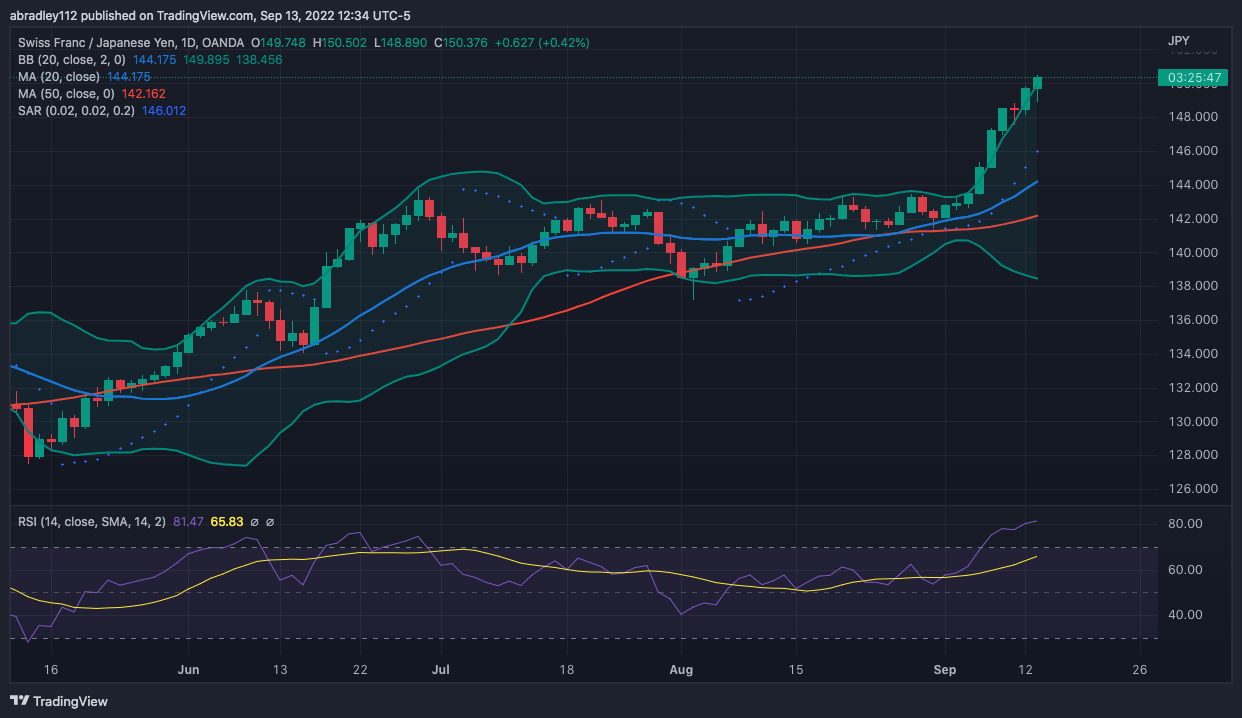
CHF has been pushing up for over a week now, after ranging for a while. Today was no different, as it made another high and was up on a day (for the 7th day in a row). JPY on the other hand had a large push down a couple of weeks ago, had a bit of a base over the last week, but made a new low yesterday and had made another new low today (though it was up a bit when I looked at it), so I wanted to look at it short.
I looked at a couple of things, but when I got to this chart, and ran the numbers, they looked to be some of the most promising. Price had been pushing up for essentially 8 days in a row (there’s one, technically, down-day within that, but it close basically at it’s open), and today looked to be no different. Looking at the 5 min. chart, price had spiked quite hard, but was slowly pulling back. It was stalling at a prior resistance area that became support, and looked to me a lot like a bullish flag pattern.
Entry – 150.0
Target – 150.4
Stop – 149.8
R:R – 2:1
Entry – 150.003
Price rallied a bit again, had another smaller pullback, and that’s where I put in my entry order.


Exit – 149.79
Price danced around my entry for a bit, never gaining too much, before it pulled back enough to stop me out a few minutes later. When I got in to the trade, while there was a huge spike in the recent past, the bands were starting to constrict again and RSI wasn’t overbought but still was above 50. And, not only did I see the flag and the bull pullback, there was a nice hammer candle just before my trade. I can’t pinpoint or think of any real mistakes I made with this trade, it’s just one I lost IMO

Further proof of that is the fact that since triggering my exit, price has pushed up to my target. It’s been slow, and it hasn’t broken out of the day’s highs at all, but, literally, the last candle at my stop price is the one that stopped me out. It’s been a steady up-move since then. Again, I think this is just a trade I happened to lose today, so I’ve just got to go in with confidence next time I trade, knowing that I will catch a trade that will wipe out these losses.