
I know I did calculations for these, otherwise how would I know if my R:R was there? That’s another reason why I need to stay on top of journaling my trades, so I can keep the calculators available and not lose track/have too many up at the same time. At the very least I should copy and paste the calculations into a new page here, as soon as a trade triggers.
I Don’t need to journal that quickly necessarily, but I should at least put the numbers here so I can A) have them for journaling and B) clear out the cells in excel so C) I don’t have to copy and paste and make a bunch of new ones. That’s what I’ll do going forward. For now, I have to surmise my thought process for this trade
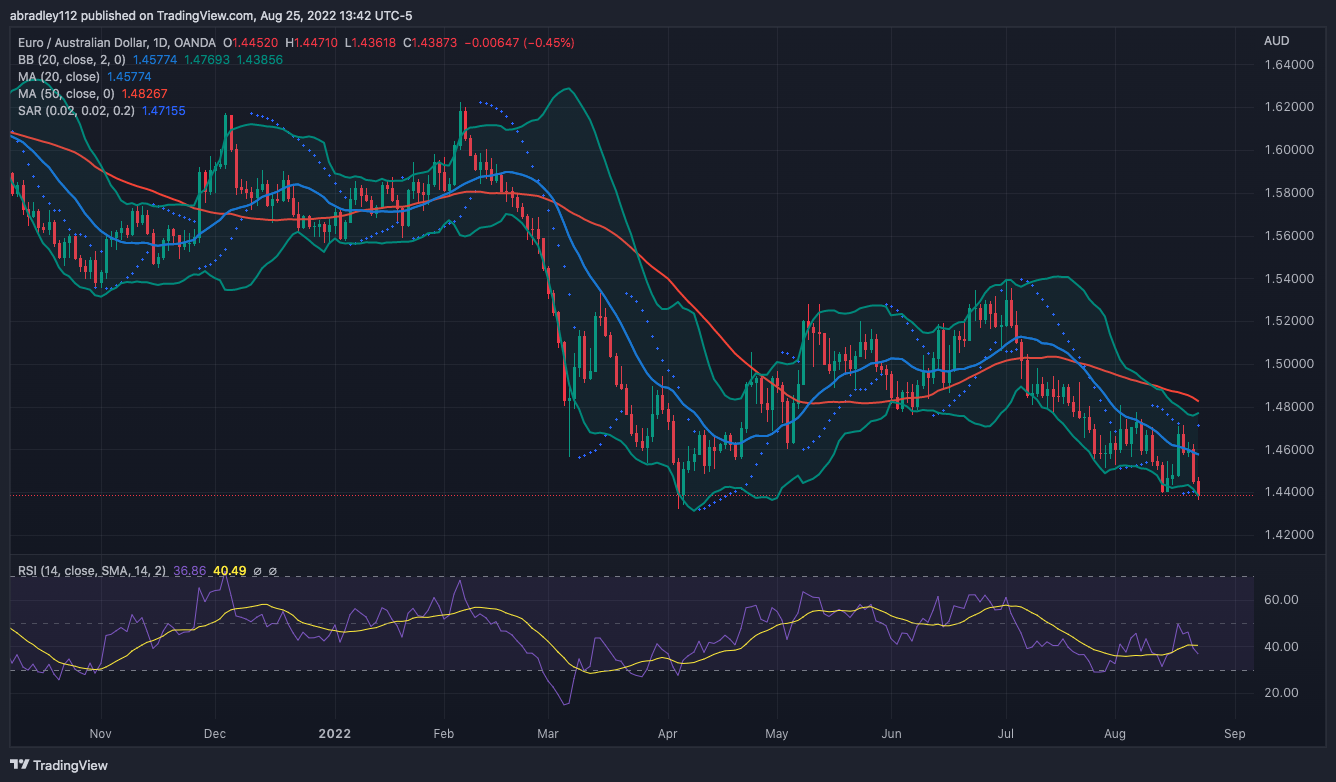
Looking at the daily chart, for the last month price had been trending down, making lower highs and lower lows. A few days before I took this trade, price made another rally, and on this day was on it’s third down day, and right near a support area. Thins looked weak to me, so I looked for entries on the minute charts.
Entry – 1.43939
On the 1 min. chart, price largely based for a few hours before pushing down strong over the course of about 10 minutes. It rallied a bit, which is where I put my entry orders in.


Exit – 1.43940
Price pushed enough to trigger me in to the trade, danced around my entry for a few minutes, before pushing fairly strongly in my favor. I had a trailing stop set, so that was pulled down with the move. Eventually, there was another rally, which got up to my entry, which is also where my trailing stop was, so I was stopped out at break even
I think this was a good trade. It was a fairly clean setup, in the direction of the overall trend. The only thing that I would say in criticism is that the downward move before I got in was probably an exhaustive move. While there was still downward pressure, it wasn’t as strong as it had been, which is why I got stopped out at break even, and not for a profit. Volume and Magnitude. Need to keep that in mind, too.
