
Welcome to my trading and investing blog. Today, I’m analyzing a short trade I took in the Forex pair AUD/JPY. Read on to see how this trade played out.
Quick thought about both of the trades I took today. They’re both counter-trend trades. Yes, I took them off “reversing” off of the upper/lower band and their RSI’s were in the direction of the trade; but the overall direction of each of these trades is in the opposite direction of the one I took. I do want to do a “mean reversion” but I also have said that I don’t want to trade against the trend. Which I did in both pairs here.
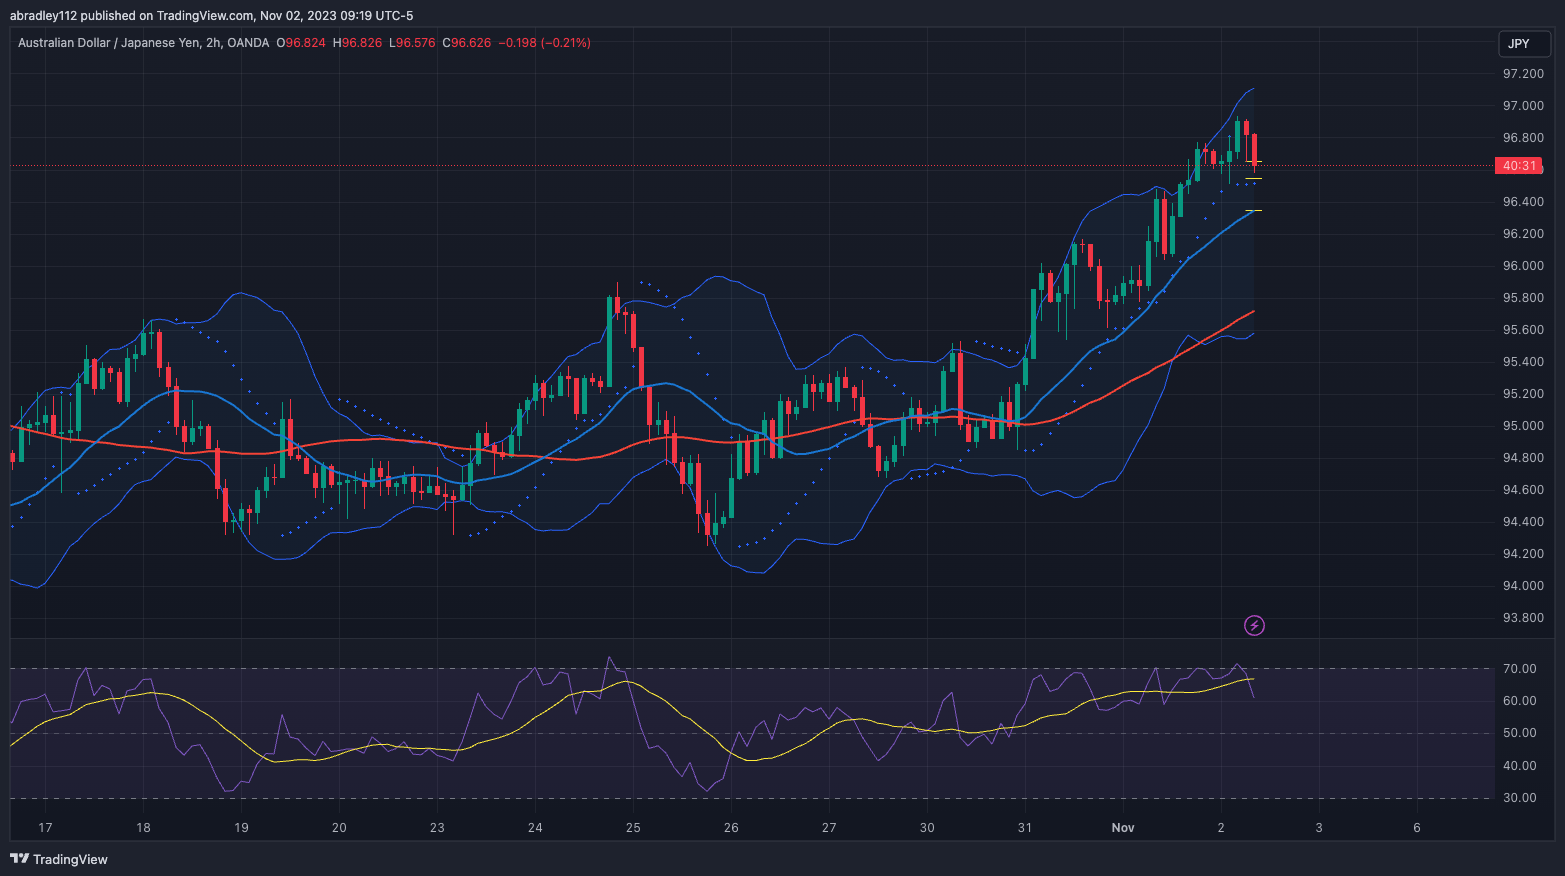
After moving sideways for a long time, price made a strong push up over the course of, roughly, the last two days. Last night (somewhat late) price pushed up to the upper band, made a slight pullback and made another push up overnight. That second push up didn’t quite reach the upper band for the second time before price pulled back again, but RSI did push slightly into overbought territory. This was all on the two hour chart.
Entry – 96.55
Stop – 96.65
Target – 96.35
R:R – 2
Entry – 96.55
The upward pressure looked exhausted, and while this was technically in an uptrend, I thought there would be a fairly significant correction that I could capitalize on. Price made a strong push down from the overnight peak, so I dropped to a lower time-frame to look for entries.
On the 5 minute chart, price appeared to break a fairly strong support area and then rally. That rally looked like a good pattern to trade in to, so I started running numbers. On the 2 hour chart, I expected price to make it to at least the moving average in the middle of the Bollinger Bands, so that was my target. I took the spread in to account when setting my entry and stop, and given all of the numbers, I had a 2 R:R exactly. That looked good to me, so I pulled the trigger.


Exit – 96.65
Less than 20 minutes after setting my entry order, price made another push down and triggered me in to the trade. It was a relatively quick move, so I felt confident. Unfortunately, though, that confidence was unwarranted.
The most price ever pushed was about 4 pips into profit, and then it rallied again. That rally stalled at that prior support (now resistance) area, and made another push down. Ultimately, this ended up moving sideways — getting up to within 1 pip of my stop, and dropping to 1 – 2 pips of profit. Price moved in this range for roughly an hour before it made the rally that ended up stopping me out.

Overall, I don’t think this was a good trade, and I called it out almost immediately. While the individual points as to why I took this trade weren’t wrong, the overall direction of price movement was in the opposite direction than I took this trade; and for that, I was wrong.
Conclusion
Maybe I shouldn’t refer to this as a “mean reversion” strategy. Maybe I should call it a continuation strategy. I’m looking for something that, overall, is trending either up or down (uptrend needs at least two consecutive swing highs with a higher low between them, and a downtrend needs two consecutive swing lows with a lower high between them), but It’s recent price action is coming out of oversold/bought territory.
So, if a pair is in an uptrend, I’m looking for price action over the last, say, 4+ hours that shows price coming out of oversold areas. I’m looking for the continuation of an uptrend after a routine pullback. That’s the goal going forward.
Potentially, I’ll look for a “mean reversion” play if price is in a long-term range, rather than trend. But I want to focus on this one strategy before I get to that. In the meantime, here’s to finding more great trading opportunities!
Thanks for reading. Let me know in the comments what you thought about this trade and if you’ve got a strategy for trading counter-trend. And, as always, stay tuned for more Forex market trades and analysis!