
Another day another trade! Or more. I’ve been primarily focused on trading Forex, and below are the trades I made today. To see the RSW I went through to determine these particular pairs, check out this post. If you’d just like to see how I did today, continue reading below.
USD/JPY – Long
I organized the pairs I wanted to look at (just by long & short) and ended up looking at USD/JPY first. Immediately, it looked like a clean retest/pullback on the 15min. Chart. It’s not extended and the pullback isn’t too deep (yet, it’s moving as I type this, if it closes below my stop, I’ll cancel the order), so I set an entry order on the break back above the resistance area.
Price ended up (on the 15 min. chart) closing below my would-be-stop before triggering my entry, so I cancelled the order.
NZD/JPY – Long
I was looking around, waiting for my USD/JPY order to do something, and I kept coming back to NZD/JPY (Actually, there were a couple of charts I liked, but the 5 – 8 pip spreads on them made me nervous, so I left them alone). This has been steadily pushing up, and nothing looks extended on the 15 min. chart.
Price started pushing up a little before the US market’s open this morning, made a peak, and had a bit of a reversal. That short down-move looks like it could either be a retest pattern or a pullback pattern before making another push back to the upside. I could also see this being the beginning of a high base, which is also a long, tradable pattern.
The spread was slightly less (around 3 pips) and it actually had a target that I liked with a strong R:R, so I put an order in here. I’ll monitor to make sure it maintains a tradable pattern and doesn’t start making any strange moves. Once again, if it closes below where I currently have my stop, I’ll cancel the order.

Price pushed up and triggered me in to the trade. The retest looked good, and the breakout from that retest also looked good, so I was confident. I had to use the bathroom, and was confident in the trade, so I went. I came back about 10 minutes later and saw that I had been stopped out of the trade.. Price pushed back down to the lows of that range and triggered my stop-loss.

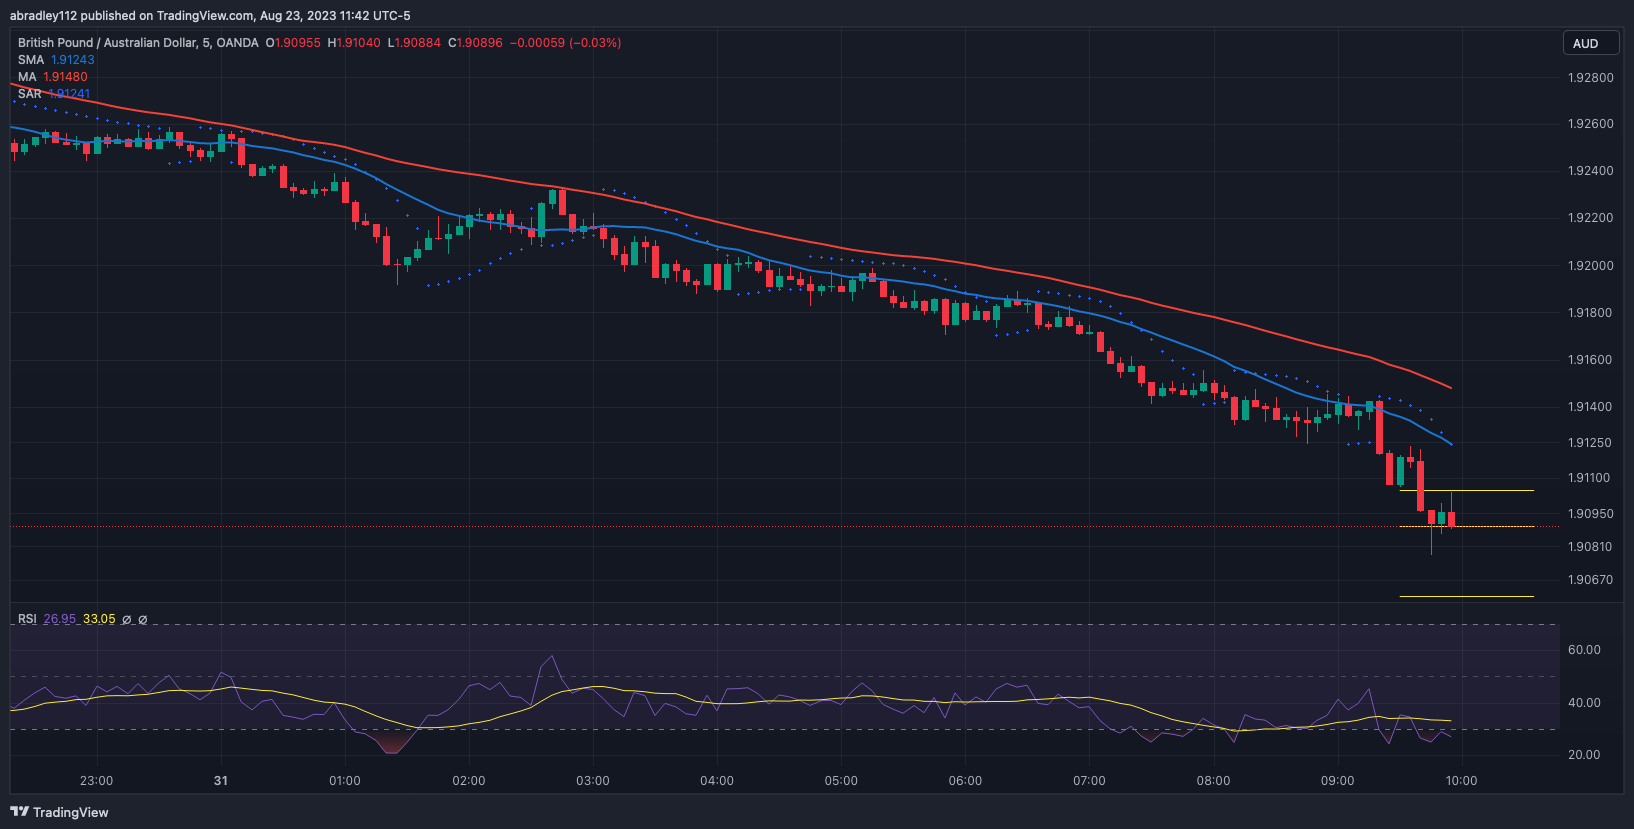
GBP/AUD – Short
GBP/AUD was weak this morning, and on my list to short. When I first got to the chart, though, I had a hard time with it’s pattern. In hindsight, I could argue a low base, but at the time, it wasn’t as clear. Especially on the 5 min. chart.
Price made a strong push down, though (which solidified the base), had a 1 candle rally, then pushed down again (which I missed) then started to base. Within the base, price made a push up to the resistance area that was created as support on the 1-candle rally I referenced earlier, which is the area I used as my stop loss.
I put an entry order at the lows of the base but, admittedly, wasn’t at a full “break out” point in the base. I might’ve placed a higher entry in order to get a better R:R. On the other hand, though, I could’ve picked a higher entry on the break of the support level that was resistance in the initial base — that was where I wanted to get in, but I lowered it based on the spread. With the 3 pip spread, price has recently triggered me in to the trade, so now I’m just waiting to see how it plays out.

Price didn’t move much after triggering my entry. It essentially hovered between my entry and stop, until it started making a small trend up which hit my stop-loss and exited me from the trade.

Not the greatest trading day today, but that’s alright. It happens. Unfortunately, I don’t see any glaring mistakes that I made with these trades, they just didn’t happen to work out. I can’t get discouraged, though. I need to get back up on the horse, continue to get better and recognize that success comes in the long-term, not the short term. Let me know how you did today, or if you have any feedback for me in the comments below!