
Updating on 5/3. This trade happened on 4/27
Want to stay up-to-date with the latest trading trends and strategies? Follow my trading journal as I document my trades, including my technical analysis, risk management techniques, and trading psychology.
I had been having less success swing trading over the last couple of weeks, so I decided to take a break. My DTs were all back, so I decided to take a stab at day-trading — see if I could make some quick money on a Thursday.
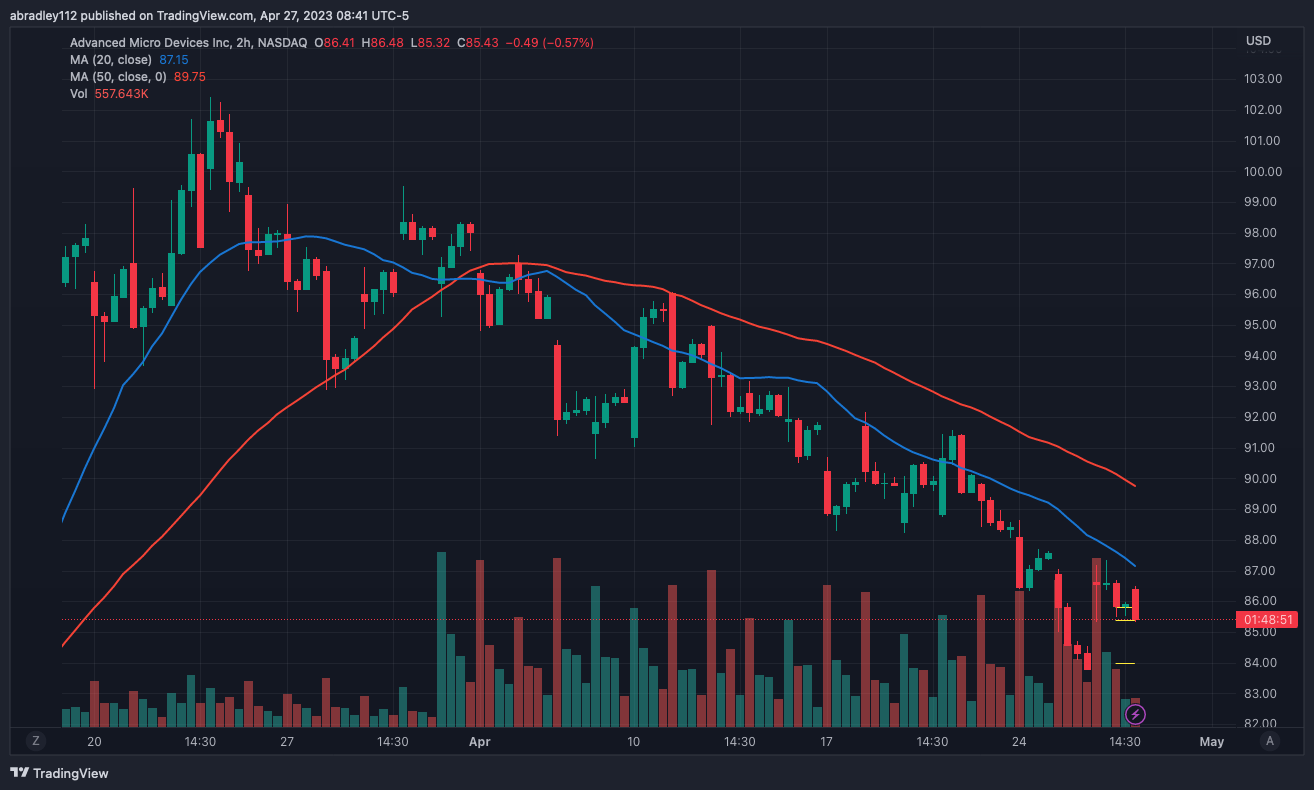
AMD’s price action had shown strength during the couple of months prior to me getting to this chart, but had peaked in late March and pushed down from there. At the same time, the S&P that morning had gapped up to some resistance after being down the last couple of days, which looked to me like a retest and further weakness; so I looked for Shorts. Here are my notes from that morning:
Since I’m planning on day-trading today, I’m starting my analysis on the 2 Hour chart. With that in mind, I just came across AMD. It was strong for a few months, but peaked in late March and has been pushing down since then. Looking at more recent activity: yesterday, price gapped up but failed to hold on to the gains and mostly moved sideways throughout the day. This morning, price is pushing back down, and is stalling at the support area it created when it gapped up. If this can push through that area and fill the gap, this could be a great move. I’m going to look at lower time-frame charts for better entries.
Entry 1 – $85.41
Price pushed down fairly quickly and triggered me in to the trade; and very quickly reached 1R. I moved my stop to break even, and felt good about it. I was even able to move my stop in to profit a little bit.


Entry 2 – $84.85
I started looking at a couple of other charts, to see if there were other day trading opportunities, but nothing was moving very quickly anymore. I came back to AMD and it had gotten near my target, but was on a rally. Scared money don’t make money, and I was quite bearish this stock, so I took another shot to the short side at that resistance area. My attempt at legging-in.

Exit (both) – $85.23
Unfortunately, it wasn’t a retest — price continued to rally and pushed up for the next three days. Ultimately, I made a little bit on my first entry, but lost a lot on my second entry, for, overall, a losing day.

I don’t hate the idea of legging in, but I definitely need more practice. One big thing I need to remember is that I don’t need to re-run the numbers to figure out how many shares to take when legging in; I need to take the same as my original position size, precisely for this reason. If I am wrong about the leg-in, I don’t want to lose more than my original position like I did in this scenario. I will be better.
Other than that, I could also argue that I shouldn’t have legged in here at all. Price pushed down strong when it neared my target, and I should’ve seen that as an exhaustive/extended move.
Overall, I’m not terribly upset with this trade. Could I have recognized a couple things? Sure. But I followed my rules, I tried to act without fear/emotion, and I took a shot at a new strategy. All positives, that will lead to success. As they say, you learn more from your failures than successes.
Obviously these few losses in a row are a bit discouraging, but I have to take things a day at a time and keep working and keep figuring things out. On to the next one!