
Updating on 4/27, trade opened on 4/19 and closed on 4/20. Since it’s been a week, I may not have the most accurate memory of what happened; but I’ve got the gist.
This is another stock whose chart patterns and price action looked really good to me when I took it, and is disappointing that it didn’t work out. I took a longer-term approach, seeing how even taking trades on a 2-hour chart were often stopping me out the same day; so this trade was taken on the 4h chart.
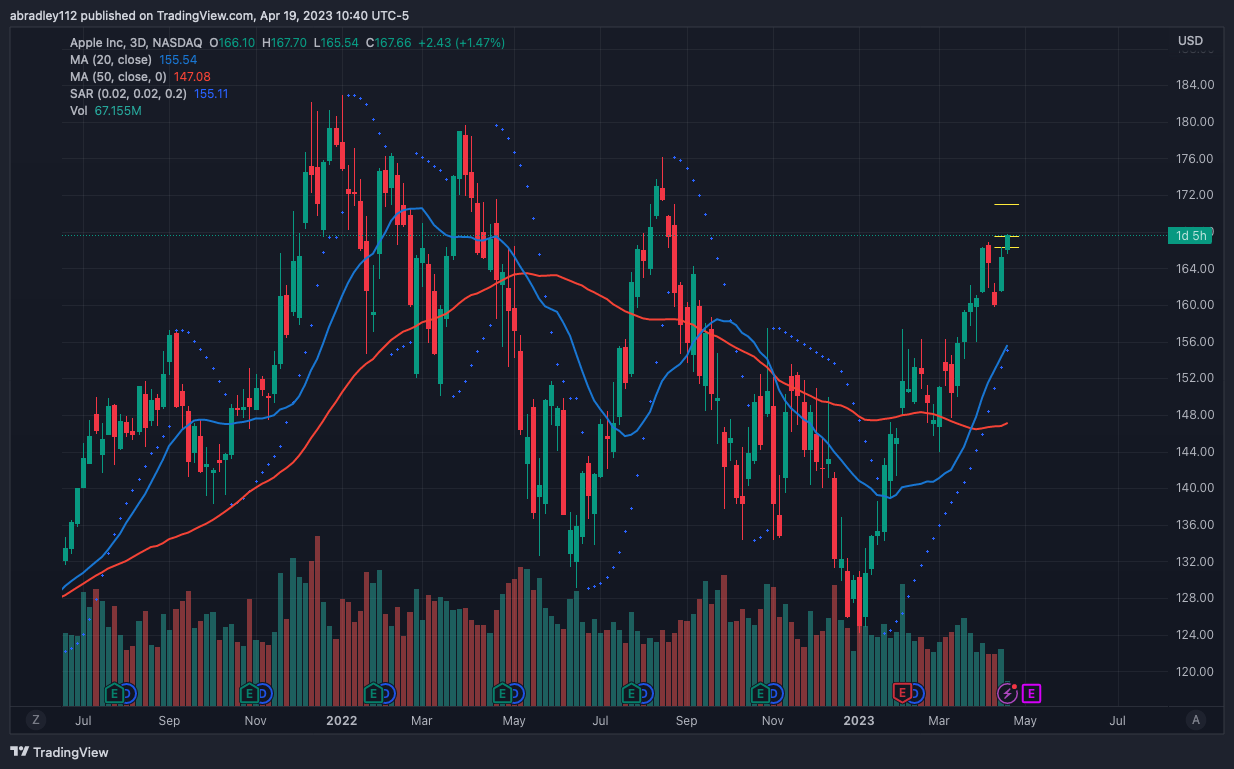
I started my trading analysis on the 3 day chart. Price had recently made a new high but at the time I looked at this, price was sitting closer to the lows of the candle (which was a prior high). I dropped down to the 4h chart, and while the candles didn’t show a pullback “pattern”, price showed a pullback — as in, within that 4h candle, price had come down enough to retest that area.
Here are my notes from that morning:
This is the first thing I’m liking this morning. Looking at the 3 day chart, price peaked at the beginning of the month, had a week or so of a pullback, then pushed back up through those highs. Today, price gapped down a bit at the open, but reached a more recent support area and is pushing back up. Other than a candle from last week, nothing here looks extended, and I already ran the numbers — getting in at a push above yesterday’s highs, with my stop at the peak that it reached at the beginning of the month — R:R is quite nice. It’s a longer-term lookout, too, so I’m comfortable putting an order out there. I can always adjust it if the stock moves strangely.
The price of this had been very strong over the last few months as well, so I thought this would be a continuation of that strength; and while I did see some resistance near my entry, I figured if it broke that area, it was even more evidence of strong upward movement, and that it would continue to run to at least the next major resistance area.
Entry – $167.50
Price pushed up and triggered me in to the trade. I wish I remember the specific circumstances surrounding the entry. It triggered around 10:30, so I imagine I found this a couple hours earlier and eventually it triggered.
Entry – $167.50
Target – $171.00
Stop – $166.30
R:R – 2.92


Things looked okay for the rest of the day after triggering the trade. Price didn’t push up as fast as I’d have liked, but it didn’t drop too quickly either. Price basically hovered around my entry until the market closed — at which point, price was sitting at my entry. I continued to feel good about the trade.
Exit – $166.02
The next morning, I got to the charts early, knowing I was in a trade; and pre-market, things didn’t look good. Price was down quite a bit, but was still above my stop. I was hopeful but getting worried. As the market open grew closer, price continued to fall; and when the market did open, price gapped right to my stop — stopping me out for a full loss right at the open.

Everything looked good here until it closed. If I had to nitpick and say there was a mistake that was made, it’s that the chart didn’t form a retest pattern per se. It may have on a lower time-frame chart, but it didn’t on the 4h. I just did it based on where the price was, not the candlesticks. Maybe I should be putting more stock (no pun intended) into the patterns and not just price action. Something to think about going forward. In the meantime, I just need to keep swimming and not get discouraged.