
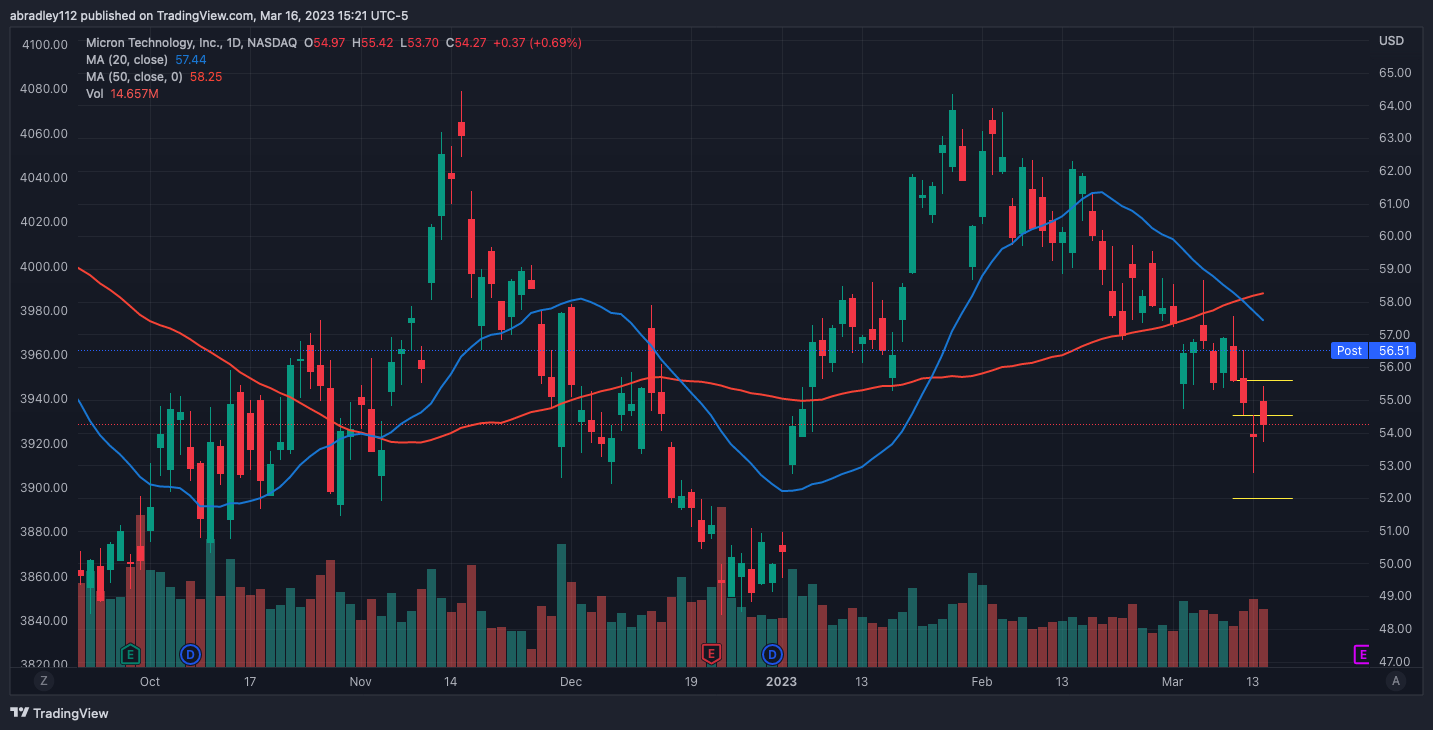
Looking at trading patterns on the 3 day chart, this has mostly been pushing down since last year, though it somewhat flattened out a bit starting September of last year. At the time I first looked at this chart, it had been pushing down again over the last several weeks (along with the market) but had a gap up to a key level that held as both support and resistance over that same amount of time. Here are my notes from that morning:
This has been pushing down for a month-and-a-half, with a strong down push over the last couple of trading days. Today, price gapped up, but gapped right to a key area that’s been both support and resistance. Looking at the 2h chart, it’s failing to hold on to those gains of the gap-up, and appears to have a lot of room to run if it breaks this level back to the down side. I’m going to run numbers here, too, and potentially enter an order.
Entry – $54.54
Target – $52.00
Stop – $55.60
R:R – 2.4
Entry – $54.53


Exit – $54.17
MU’s stock price made a good push down throughout the rest of the day, but didn’t quite get to 1R. I debated on moving my stop anyway — in case there was a gap, I’d break even rather than lose a full position — but ultimately decided against it. I was looking for a downward move over the next couple of days, so I figured I’d give it room to breathe.
The next morning, price did gap down making it, eventually, a little beyond 1R. I moved my stop to break even, and then ultimately a SAR dot at $54.17; which is where it was left when price rallied at the end of the day and triggered me out for a small win.

Price made a small base, pushed down, rallied back to that base (a level which had held as support at another point prior to that base) and I set my entry below that level. It didn’t end up being a runner, but I followed my rules, I did a full top-down, I liked the chart for multiple reasons, and ultimately it was a win. I want to keep looking for moves like these, and in doing so I’ll catch the big runs when they happen.