
I was looking for trading patterns that suggested shorts, and this was actually the first stock I looked at. I didn’t really want to trade TSLA for a couple reasons — since it was the first stock I looked at, it kind of felt forced; and, it kind of feels like a meme stock — but I didn’t hate the chart, so I took a deeper look. Here’s my notes from my analysis that morning:
Entry – $180.00
Target – $173.50
Stop – $182.50
R:R – 2.6
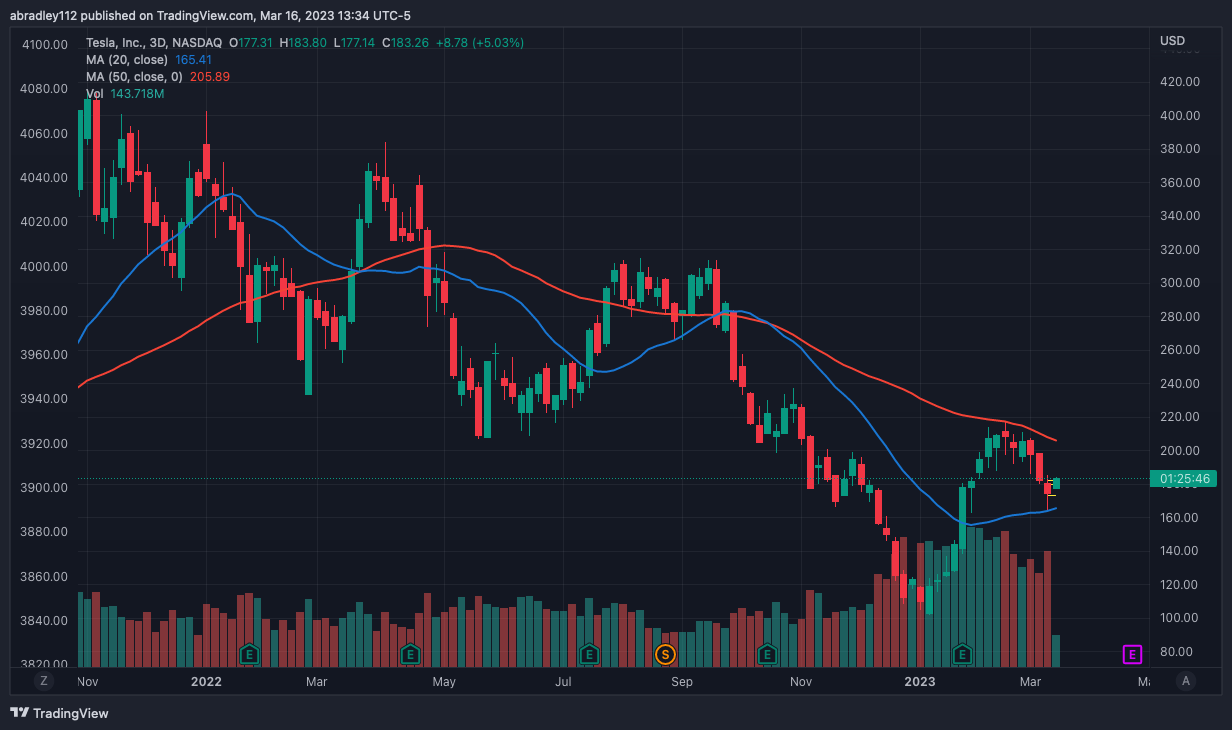
Starting at the 3D chart, this has been pushing down all year, though there’s been a small pop over the last couple of days. Like the overall market, though, I’m bearish, and this is retesting a key level, and on the 2h chart, it’s testing the 20MA. It looks to me that if this drops below $180, it could make a strong push down, and on the 2h chart, my stop is at a nice resistance level at ~$184. I’m not sure if the R:R is there yet, I haven’t picked a target yet, but if it is, I’m going to add an entry order
Entry – $179.95


Exit – $182.50
I saw that price triggered, so I set an alert in TradingView to let me know when it hit 1R. I looked through some other charts, put out another entry order, and got lost in social media for a bit when I heard the sound of a trade triggering. I was upset, thinking I had lost this trade, but when I looked, it was the other order I put out triggering.
I looked at TSLA at that point, and noticed that I had been stopped out of the trade, about an hour prior. In doing other things, I completely missed it. Looking at the chart now, price based around that area for most of the day, and during that base, it pushed up enough to trigger me out of the trade. Price did reach 1R after that, but quickly rallied again, and is up on the day today.

I took this on the retest, and the initial break of the resistance area, not after a base, so I think I’m happy with the trade. I can’t think of anything, trading-wise, I did wrong here. Given that price has rallied and is up now suggests I was just wrong about the direction of the stock in the near-term. That’s fine, it’ll happen. The argument can be made that a downtrend wasn’t established, and for that reason, I shouldn’t have taken the trade (price made a lower low, but hadn’t made a new lower high yet — it might be doing so now). The drop over the last couple of weeks was sharp enough, though, that I still liked it to the downside. I’m dealing in probabilities and am going to be wrong sometimes. This is one of those times.