
I didn’t end up seeing anything I liked in the original six stocks I looked at initially this morning, so I refreshed my screener and looked again. This (YOU) came up and looked promising. I’m just looking at a 2h chart and price showed decent recent activity.
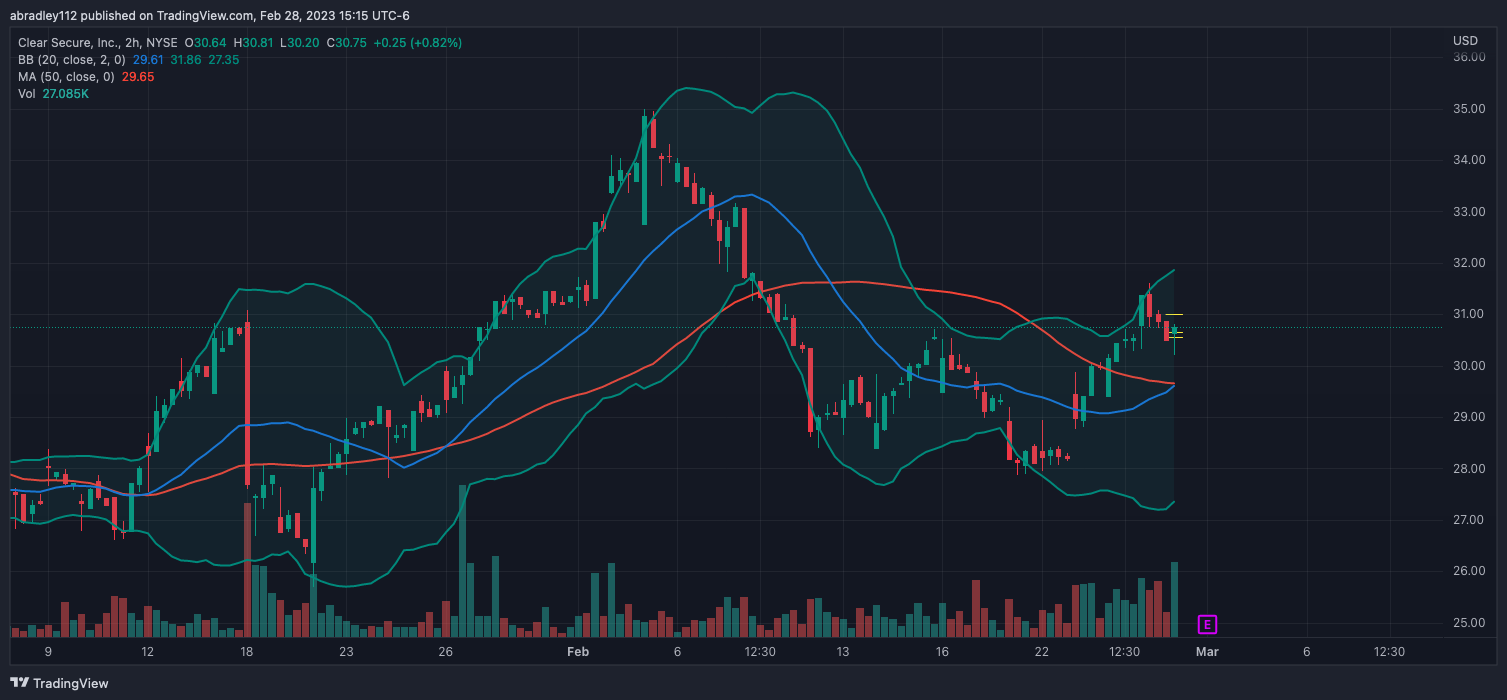
Price bottomed out last week, moving sideways and then pushing back up in the middle of the week. Price peaked yesterday and pulled back most of the day, retesting a resistance area from back on the 16th. It looked to me like a nice retest to take long, so I looked for entries on the 5min. chart.
Entry – $30.67
I know it. I say it all of the time. I’m not going to trade bases anymore. But this one was so clear, I couldn’t resist. There was some sideways movement earlier in the day, then a nice push up that didn’t look extended, then some more sideways movement. Based on my target on the 2h chart, taking this long on the highs of the base with a stop at the lows offered a 3.5 R:R. I pulled the trigger.
Entry – $30.65
Target – $31.00
Stop – $30.55
R:R – 3.5


Exit – $30.53
This was rather slow moving, but price eventually made a nice push up to break out of the base and trigger me in to the trade. That candle, though, closed on the lows, and price pushed down from there. Eventually, just enough to stop me out of the trade.

The messed up thing is, again, this decided to make a nice push up after it triggered my exit — eventually pushing through my target. The only thing I can think, that isn’t the application hunting my stop losses is that I was on of the few sellers at that price, and buyers with limit orders got filled on my stop.

Either way, I can’t really say it was a good trade since I’m trying not to trade bases, but it was good in the sense that I was right about the direction, again, just not about the timing. Maybe, on bases, I try to buy at the bottom of the base and putting my stop at the highs of the next key level (and vice-versa when shorting). It’s worth exploring for a while in my practice account when/if I come across that scenario again.
In the meantime, I need to be tighter with my setups, and look for my patterns, be more patient, and not force things.