
Here are my notes from my analysis on Monday:
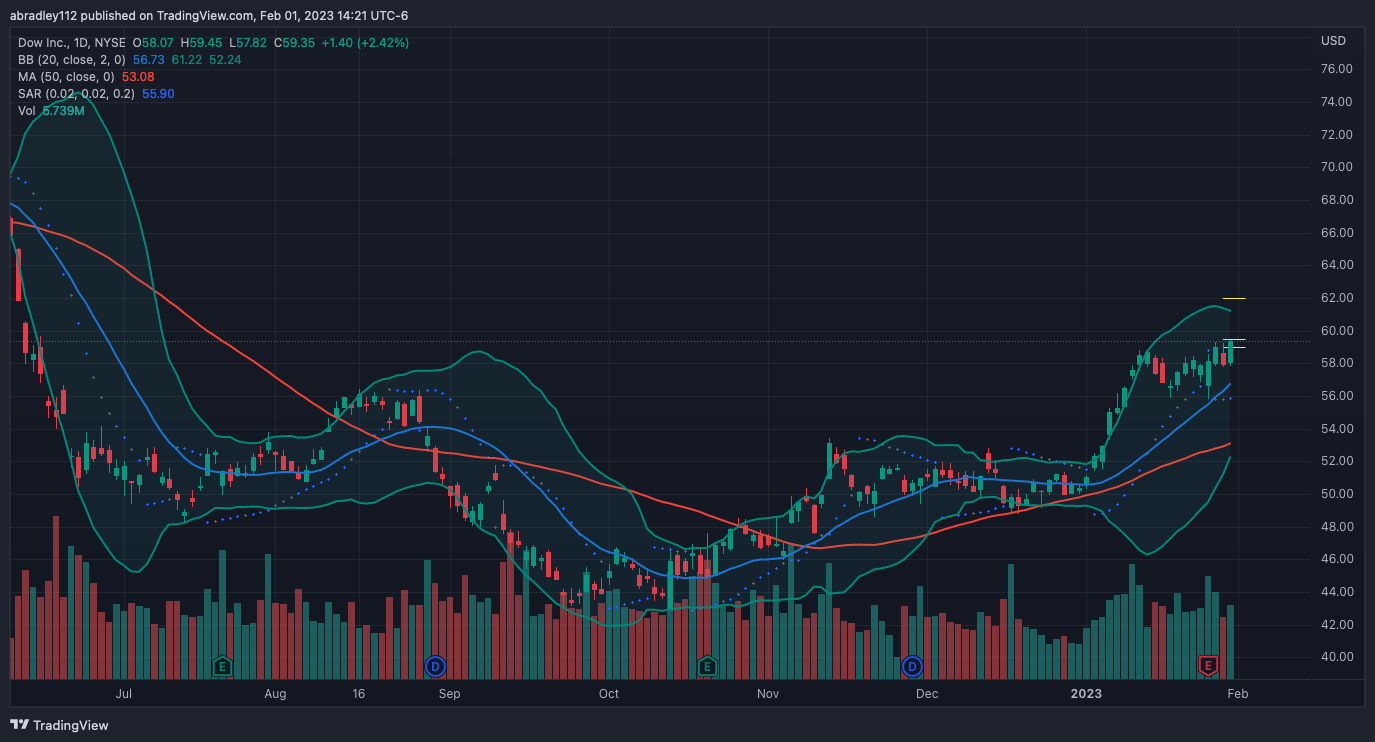
This had a vertical drop over a couple of weeks last summer, gained some of that back, moving sideways with a slight upward trajectory over the next 2 months, then dropped fairly sharply again until the end of September last year. Since then, price has steadily been pushing up — though there’s been periods of chop/sideways movement. Since the beginning of the year, price has continued it’s upward push, having 9 up-days in a row to start the year, and took out the resistance area from back in August.
Over the last couple of weeks, price has been moving sideways again, and I can even see a fairly clear double-bottom that’s formed and was technically broken out of on Friday. Price has pulled back quite a bit today, but is staying near the highs of the range (the “neck” of the double-bottom). This looks like a nice base to take long, with a good amount of room between the current price and the next resistance area, so at first glance it looks like it’ll offer a good R:R. I’ll definitely put some focus here and look for a good entry point/pattern.
Entry – $59.50
I wasn’t going to trade today, but glanced at my watch-list anyway, and DOW was in a high base that I didn’t want to ignore. I ran the numbers, and — well technically, when I ran the numbers initially I didn’t have a good enough R:R, but the daily chart appeared to have such a large gap to the next recent major resistance area that I wanted to take a shot. I picked a slightly higher target that would give me a better R:R.
The base was a nice, sideways 3 bar move, but the candle that opened after I entered my order was more of a hammer than one conforming to the base. IDK if I’ve put this down somewhere yet or not, but recently I’ve been considering not trading bases anymore, and this just speaks to that. From now on, I think I’m only going to focus on pullbacks/retests and if I do trade any bases it’ll be something like the initial one I saw this morning; and when that next candle happens that doesn’t immediately break out, or at least conform to the sideways movement, get out/cancel the trade.
Entry – $59.50
Target – $62.00
Stop – $59.00
R:R – 5


Exit – $58.95
Anyway. I waited for that candle, and eventually price did trigger me into the trade. I had an alert set for 1R, it became lunch time, and price was hovering around -.5R. I ate lunch and was sitting on the couch when I got the TradingView alert that price hit 1R, so I came back to the computer. I looked at my position, and it was 0. Price had pulled back, triggered my stop loss, exactly at 2:00, and spiked.


What do I say about this one? I had the analysis, I liked the pattern, initially anyway. On those bases, yeah, I think I need to close the order if it doesn’t spike immediately, and otherwise focus on deeper pullbacks and retests and moves off of that. I’ve had a lot of success with those types of patterns and movements, so I want to stick to that. Here’s to it.