
This one might’ve been forced. IDK. EUR/USD was a pair that I wanted to look at this week based on the RSW I did on Monday, but looking at the daily chart, it’s been on a bit of a small rally over the past week or so. After taking the GBP/USD trade, though, and not seeing another signal (or, maybe, being afraid of taking another trade in that pair or something), I looked through other pairs for opportunities.
I was still looking at 1/3/5 min. charts, but I looked over at the overall change% and this was, at the time, down on the day. When I clicked on the chart, I saw a nice pattern that could be shorted in to, but I didn’t double-check the daily chart (or even 4h chart) to complete my top-down analysis
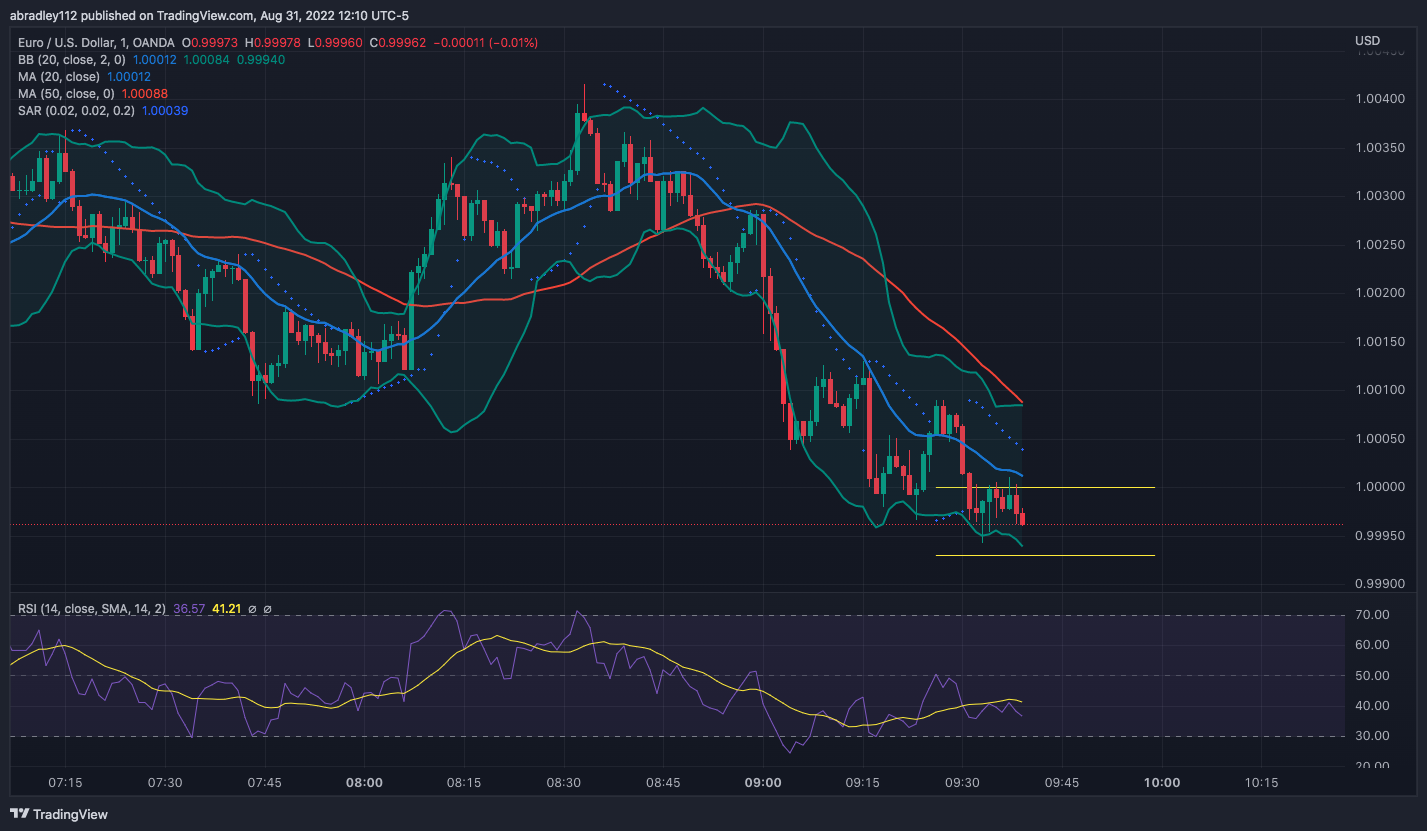
Entry – 0.9993
Target – 0.998
Stop – 1.000
R:R – 1.86:1
Entry – 0.99925
On the minute chart, Price had pushed down to a support area, rallied, and when I got here, was back testing that support area. Like I mentioned before: it looked like a great short, I liked the pattern and had already picked this pair, so I set entry orders.


Exit – 0.99944
Price pushed down quite a bit shortly after triggering the trade, getting to nearly 1R, but then a lot of volatility came in and price had some (relatively) sizable candles for the next 10ish minutes. During that time, price pushed up enough to hit my trailing stop, at an essentially break-even loss.
I think my biggest mistake here was not doing a top-down, and making sure things were pushing down on higher time-frames. I rushed it a bit. It was still a similar result to most of my trades — hell maybe even better than some — but I’m not sue if it was the best idea …
Tomorrow (9/1/2022) my plans are to A) actively manage my trades and not use a trailing stop and B) ensure I do a top-down, starting at least with the 4h chart (since I’m day-trading) and making sure the overall trend is correct.
