
Looking at the daily chart, here, I might’ve gotten lucky. I was looking at my RSW chart, trying to find pairs, and the one’s moving furthest away from each other, by my eye, were just ranging and had been for a while. There wasn’t much opportunity, so I left them alone. I wanted to find something that was moving, so I looked up a volatility meter, and used one from myfxbook.com that looked good.
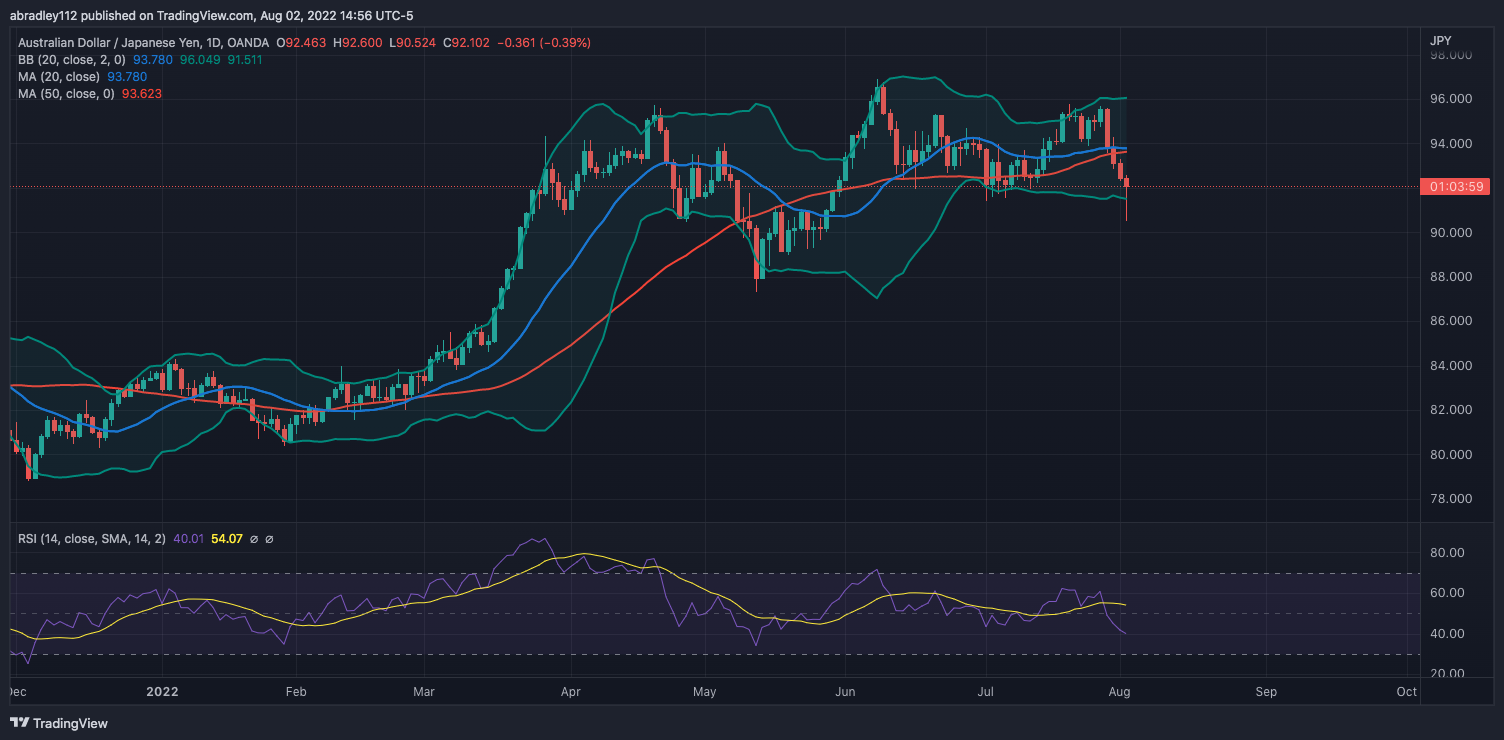
A couple of the highest volatility pairs are one’s I’ve never traded, so I ignored those, and AUD/JPY was the highest ranking one of the pairs I do trade. When I got to the chart, I’m not 100% sure what I actually looked at for my top-down. Looking at the daily and 4h charts, now, price had been pushing down for the last several hours.
Entry – 91.6
Regardless, when I got to the 1min chart, price was pushing up, and over the last 5 – 7 minutes, was pulling back/retesting a prior resistance area. When I initially ran the numbers, the R:R wasn’t quite there, but I pulled my entry back to near resistance instead of outside of resistance, so I could get a better R:R level; and when I did that, it was great — great enough that I put in an entry order, this time with a trailing stop.
Entry – 91.6
Target – 91.86
Stop – 91.5


Exit – 91.86
After triggering into the trade, price largely just pushed in my favor the entire time until it hit my take-profit. I said earlier that I may have gotten lucky with this one, but unlike the other 2, I at least took this trade in the direction of the overall trend (whether I actually looked hard at it or not). The only, real, downside was that I made a slightly aggressive entry, but it worked out. Hopefully that didn’t just teach me a bad lesson, but I’m going to go for R:Rs over perfect entries, I think.
