
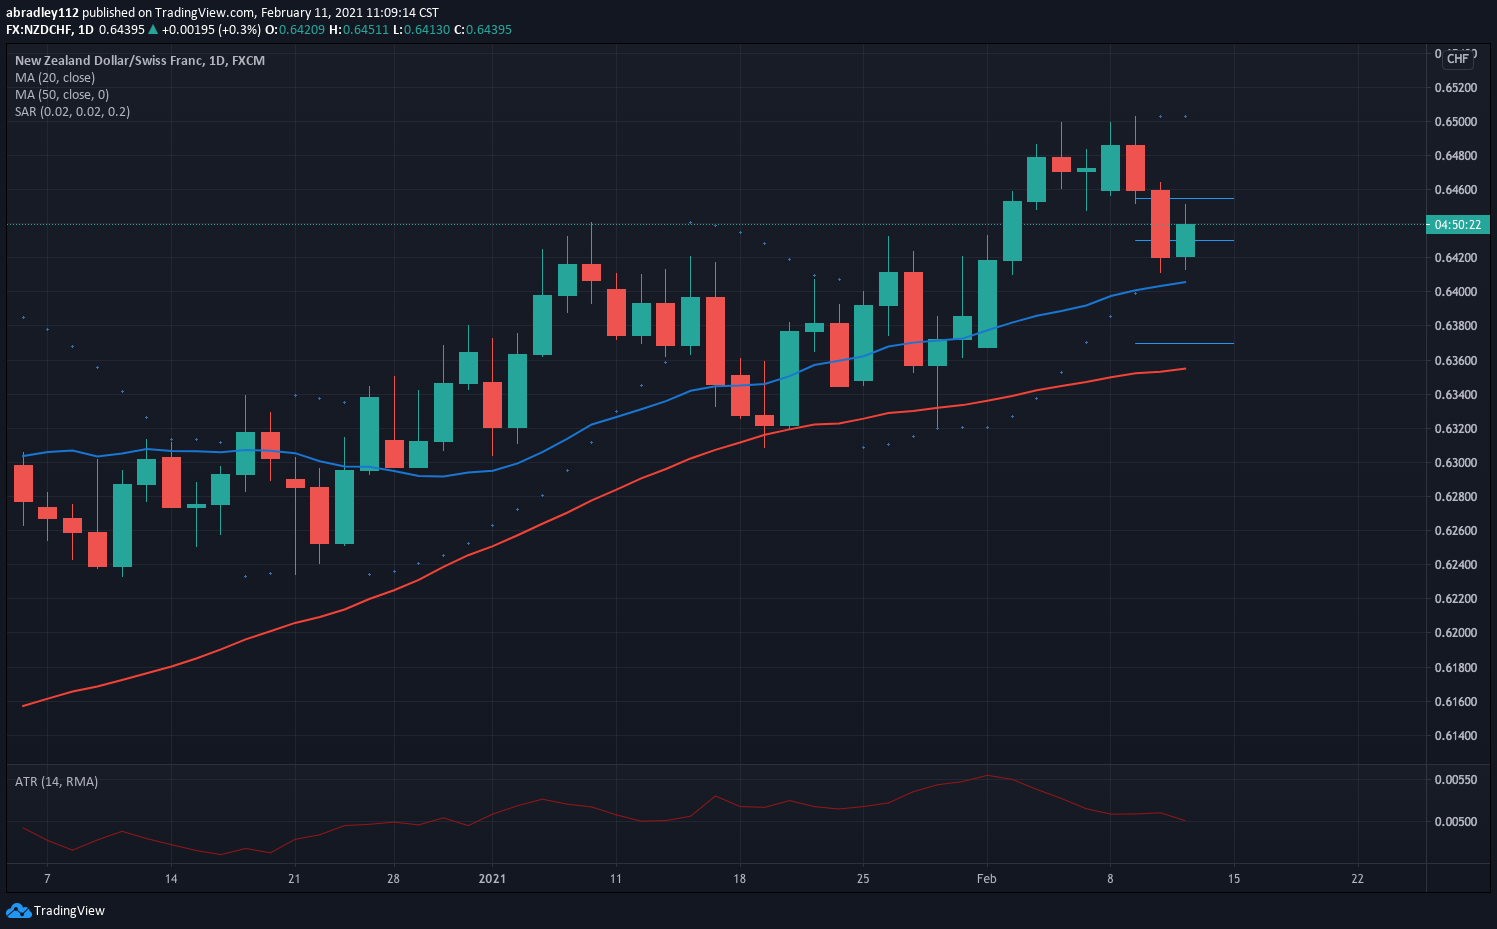
Equities weren’t moving much at all this morning, and I didn’t really think I’d find much in the way of an opportunity. I found NZD and though it’s been trending upward mostly for the year, it was pushing down for the last few days, and on the 4h chart the 20MA crossed under the 50MA.
Looking at CHF, my initial analysis was, really, that it could go in either direction. It was overall down, but definitely making moves that suggested a reversal. In order to find something to take long against NZD, I looked at the RSW JPY chart. Looking there, with about 3 days worth of information, CHF was showing to be one of the strongest. Since my outlook was in either direction, I was comfortable with that nudging me in the “long” direction for CHF.
When I got to this chart, it looked almost exactly like and upside-down NZD basket. It was down for a couple of days, had a bit of a rally, and appeared to be pushing back down. The pattern is something of a hybrid between a bear rally and a bearish retest as I didn’t wait for price to break the lows before the rally, but I also didn’t take a limit order at some resistance. I waited until this showed signs of pushing back down, but before it pushed all the way to the lows. About an hour after setting my entry orders, maybe 2, price pushed down and triggered me into the trade.
Entry – 0.6429


Exit – 0.6425
Disclaimer: Updating on 3/8
After triggering into the trade, price mostly danced around my entry until I went to bed. I’m not sure if I woke up at some point in the middle of the night, or caught it when I woke up, but around 2/3 AM, price had reached 1R so I was able to move my stop to break even. It wasn’t too long after that, though, price rallied enough to stop me out near that area.
Looking at the chart today, I’m not sure if I made 4 pips because of slippage, because I set my stop 4 pips in profit when I moved it to “break even”, or if I was able to move it following the SAR once, but it looks like it was a little more than just a break even trade.
