
I decided to take a breath and focus on the baskets without putting too much weight into what the equities were doing. Seeing as how JPY had been pushing down slightly on risk-off days, and AUD and NZD weren’t correlated, I thought that was a good idea. The only currencies that looked interesting to me were USD and CAD.
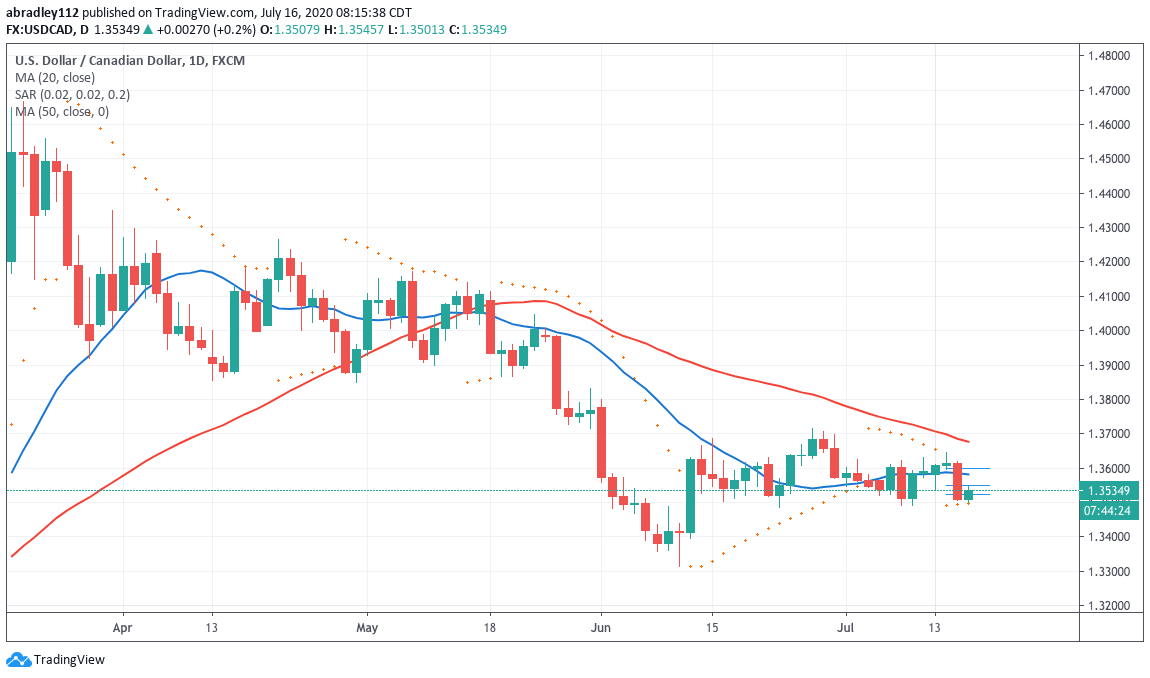
USD was on it’s second up-day and hovering around some resistance — it looked like it could potentially have a move up to the next level of resistance. CAD had spiked yesterday, but prior to that pushed below some pretty major support levels. The MAs were moving downward, and price was down on the day coming off of that spike. I liked it to the downside so I took a look at this pair.
The daily chart looked like and upside-down version of CAD’s chart, with a large drop yesterday and a bit of a recovery today and on the 15 min. chart there was a nice big U that formed and MAs had crossed over and were heading upward. It wasn’t the prettiest base I’ve ever seen, but it was a base, and the R:R available made it worth it so I set entry orders.
Entry – 1.35487
Not a whole lot happened right away, and I actually had to adjust my stop a little because price pushed down. It offered a slightly less desirable R:R, but I still liked it. Eventually, price pushed higher, and ran up triggering me into the trade and quickly getting to a point where I could move my stop to break even.
I decided to immediately start following the SAR on the 15 min. chart to lock in profits in these conditions, and as of now, I’m up. I’m going to continue following the SAR and see how much money I end up making!


| Entry Order Level |
|---|
| 1.35487 |
| Stop Loss Level |
| 1.351 |
| Target Level |
| 1.36 |
Exit – 1.35688
I wanted to be more aggressive with taking profits, given the market conditions, so instead of using 1R as my time to move my stop to break-even, I used the next resistance level (wasn’t quite 1R away). Once that happened, I began following the SAR on the 15 min. chart with my stop so that I could lock in profits.
The SAR got to a point where it was above the candles, so I left my stop where it was. Price based right around that level for the rest of the day into the next morning which is when it pulled back far enough to stop me out.
Looking at the charts now, price did push up to my target level, but after basing for a long time, and when it got up there, it barely touched that level (technically, I don’t think it actually hit my target price), and pulled back lower than the range it was in. It was a nice 20 pip profit, and I’m happy with that.
